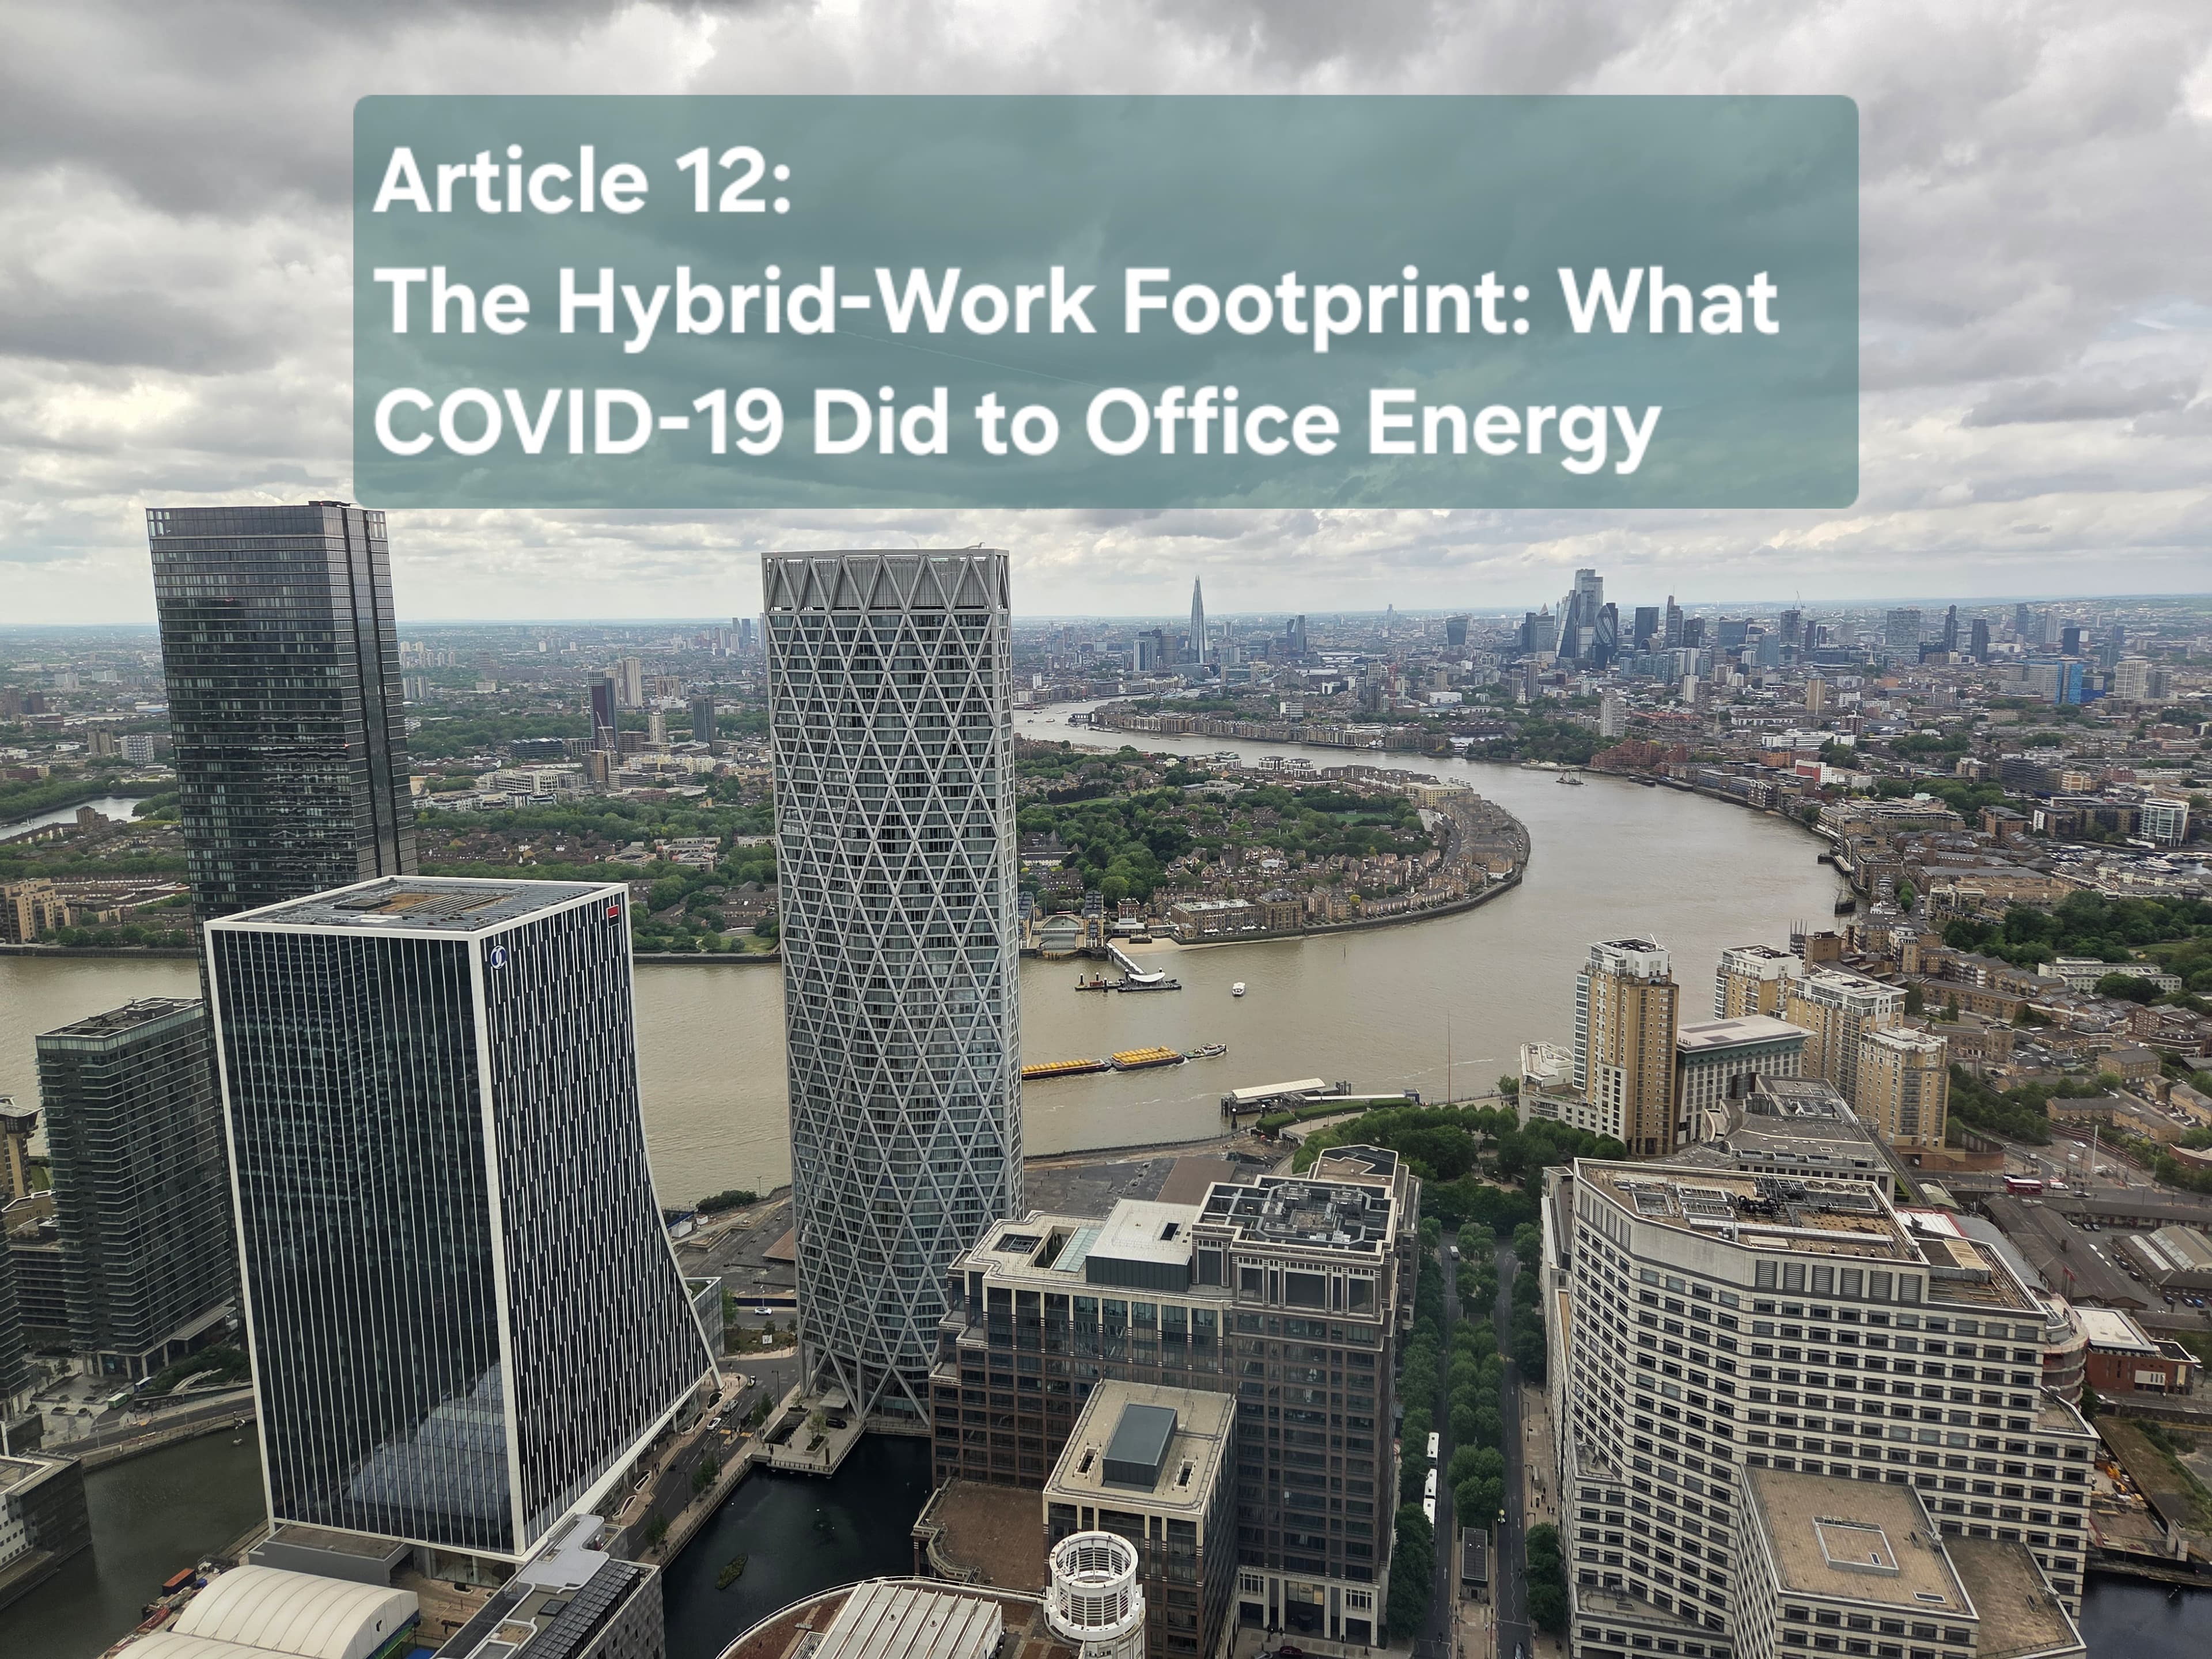
Article 12: The Hybrid-Work Footprint: What COVID-19 Did to Office Energy
A series mining the PhD thesis on London and UK office buildings (Azhari, 2025). Key takeaway. Hybrid work did not deliver the linear energy saving the headlines implied: some demand shrinks when occupancy drops, base-building load holds steady, and fresh-air ventilation actually grows.
A series mining the PhD thesis "London and UK Office Buildings: Investigating Energy Use and Landlord-Tenant Influences" (Azhari, 2025).
Key takeaway. COVID-19 changed how offices were used, not just how full they were. Hybrid work did not deliver the linear energy saving that early commentary expected. Some sources of demand shrink when occupancy drops, others hold steady, and a few, such as fresh-air ventilation, actually grow.
Chart
Hybrid work did not empty the building in energy terms
Office energy use barely fell as occupancy collapsed: base-building load held steady and COVID ventilation guidance pushed HVAC up, so the linear cut the headlines implied never arrived.
The intuition that turned out wrong
In April 2020, with most UK office workers at home and the lights off in central London, a popular question emerged. If offices are empty, are we saving energy? The intuitive answer was yes. The empirical answer is more complicated.
Two pieces of evidence from this thesis tell the story. The qualitative interviews conducted during the 2021 lockdown describe how landlords actually ran their buildings during that period. And the Santos and Azhari (2021) paper, written alongside the thesis work, examined whether working from home actually reduces GHG emissions at the system level.
Both pieces converge on the same conclusion. The relationship between hybrid work and energy use is not linear. Some sources of demand shrink when occupancy drops. Others do not. A few actually grow.
Why empty does not mean off
Three operational realities kept commercial office energy use higher than the headline occupancy numbers suggested.
The first is ventilation. COVID-19 health guidance increased fresh-air requirements substantially. As one landlord interviewee put it:
"Compliance with COVID-19 ventilation requirements meant we had to supply more fresh air, which increased HVAC energy use."
A building running at 20 per cent occupancy but supplying 100 per cent fresh air does not have a 20 per cent HVAC load. It has something closer to 100 per cent.
The second is base-building demand. Lifts, lobbies, common areas, security, server rooms, refrigeration in catering spaces and BMS itself run more or less regardless of occupancy. In a typical multi-let office, base-building demand is between 30 and 50 per cent of total electricity. That portion does not scale with occupancy at all.
The third is operating-hour drift. Buildings designed for predictable 9-to-5 occupation now host irregular all-day, all-week, all-floor occupation as employees come in on individual schedules. Plant that used to ramp up and ramp down on a known schedule now runs longer or less efficiently because the schedule is unpredictable.
The net effect is that the energy savings from hybrid work were smaller, slower and more uneven than the occupancy headlines implied.
The home-versus-office swap
Santos and Azhari (2021) examined the broader question of whether home working reduces greenhouse gas emissions overall. The paper sits at the system level, not the building level, but the conclusion bears on the office story.
Home working displaces some commuting emissions and some office-building emissions. It also adds some home-heating emissions (a worker at home runs the heating in their flat or house all day rather than benefiting from the shared heating in the office), some home-equipment emissions (additional monitors, lights, equipment) and some kitchen energy (more cooking at home than in a canteen). The net savings depend on the carbon intensity of the home heating fuel, the efficiency of the home, the distance and mode of the displaced commute, and the energy intensity of the office.
The headline conclusion is that home working can reduce GHG emissions overall but the savings are smaller than the linear no-commute, no-office intuition suggests, and in some configurations the savings become negligible or even reverse.
This is consistent with the building-level observation that the office does not empty out in energy terms even when it empties out in headcount terms.
What the post-pandemic operating profile looks like
The interviews conducted in early 2021 caught the office sector mid-shift. By 2025, a steadier picture has emerged. It has three components.
Average daily occupancy is structurally lower than pre-pandemic. Most professional services and corporate offices run at 50 to 70 per cent of the 2019 baseline, with a mid-week peak (Tuesday to Thursday) and a low Monday and Friday.
The variance in occupancy is structurally higher. Plant and operations now have to cope with a wider range of load conditions than they were designed for. This is a controls challenge as much as an energy challenge.
Lease decisions are shifting. The interviews documented funds delaying or rescaling refurbishment programmes during 2020 to 2021. The longer-term effect, visible since, is that tenants are taking less space than they used to and landlords are reconfiguring portfolios to consolidate occupied space into fewer buildings. This is good for energy efficiency at the portfolio level but creates stranded-asset risk for buildings that empty out faster than they can be repurposed.
The implications going forward
For policymakers, hybrid work strengthens the case for operational rating rather than asset rating. A NABERS-style scheme captures the new operating profile directly. An EPC, computed against standardised use, does not see it.
For asset managers, hybrid work strengthens the case for granular sub-metering, BMS analytics and active operational tuning. The marginal kilowatt-hour in a hybrid-work office is more likely to come from controls and operating-hour management than from fabric upgrades.
For tenants, hybrid work strengthens the case for green-lease provisions on data sharing. Without tenant-side data, the landlord cannot manage the variable load and the tenant cannot demonstrate the share of overall demand they are responsible for.
For researchers, hybrid work pushes the empirical question forward. The 2017 dataset behind this thesis is pre-pandemic. A 2025 dataset would tell a different story in several dimensions. That study has not yet been done at the scale of the original 3DStock work, but it should be.
What the data does not see
Quantitative data in the thesis is from 2017 and does not include the pandemic or post-pandemic operating profile. Interviews were conducted in early 2021 in lockdown, before hybrid patterns had stabilised. Themes captured are early signals, not steady state. The Santos and Azhari (2021) paper estimates GHG effects of home working at the system level, not at office-asset level; extrapolation needs care. COVID-driven ventilation requirements have since relaxed in many jurisdictions. The HVAC energy uplift described is specific to early-pandemic guidance. The piece reflects the office sector. Other non-domestic sectors (retail, hospitality) have followed different post-COVID trajectories.
The final article in the series is a technical companion to Article 3. Article 13 walks through how the thesis chose between four candidate models on the office stock, why interpretability tipped the decision to linear regression, and what the choice says about modelling building energy more broadly.
Limitations
Quantitative data in the thesis is from 2017 and does not include the pandemic or post-pandemic operating profile. Interviews were conducted in early 2021 in lockdown, before hybrid patterns had stabilised. Themes captured are early signals, not steady state. The Santos and Azhari (2021) paper estimates GHG effects of home working at the system level, not at office-asset level; extrapolation needs care. COVID-driven ventilation requirements have since relaxed in many jurisdictions. The HVAC energy uplift described is specific to early-pandemic guidance. The piece reflects the office sector. Other non-domestic sectors (retail, hospitality) have followed different post-COVID trajectories.
References
-
Azhari, R. (2025) London and UK Office Buildings Investigating energy use and landlord/tenant influences. Doctoral thesis (Ph.D), UCL (University College London). URL: https://discovery.ucl.ac.uk/id/eprint/10204821/
-
Santos, G., and Azhari, R. (2021). Can we save GHG emissions by working from home? Environmental Research Communications. doi:10.1088/2515-7620/ac3d3e. Available at: https://doi.org/10.1088/2515-7620/ac3d3e
-
Bunn, R., Mavrogianni, A., Azhari, R., and Burman, E. (2022). Delivering Net Zero Carbon in the Workplace. British Council for Offices. Available at: https://www.bco.org.uk/Research/Publications/Delivering_Net_Zero_Carbon_in_the_Workplace.aspx
-
Better Buildings Partnership (2023). BBP Climate Commitment. Available at: https://www.betterbuildingspartnership.co.uk/member-climate-change-commitment
-
BEIS (2021). Performance-based policy framework consultation. Available at: https://www.gov.uk/government/consultations/performance-based-policy-framework-in-large-commercial-and-industrial-buildings
-
Allen, J. G., MacNaughton, P., Satish, U., Santanam, S., Vallarino, J., and Spengler, J. D. (2016). Associations of cognitive function scores with carbon dioxide, ventilation and VOC exposures in office workers. Environmental Health Perspectives. Available at: https://doi.org/10.1289/ehp.1510037
Read next
About this series
This article is part of a fifteen-piece series adapting the 2025 PhD thesis "London and UK Office Buildings: Investigating Energy Use and Landlord-Tenant Influences" (Azhari, 2025) for a mixed academic and industry readership. The empirical findings draw on the 3DStock model of 6,038 office Self-Contained Units in Greater London with metered energy data for 2017, supplied by BEIS under a data-sharing agreement, alongside the Better Buildings Partnership Real Estate Environmental Benchmark. The qualitative findings draw on semi-structured interviews with seven major UK property organisations, conducted during the 2021 lockdown. Interviewees and their organisations are anonymised by role and organisation type. Please cite the original thesis for academic use.
Author. Rayan Azhari completed his PhD at the UCL Bartlett School of Environment, Energy and Resources in 2025, supervised by Paul Ruyssevelt and Kathryn Janda. The research was supported by the EPSRC Centre for Doctoral Training in Energy Demand (LoLo) and UK Research and Innovation through the Centre for Research into Energy Demand Solutions.
Other articles in the series. Article 1 The 30/85/89 Problem; Article 2 Why EPCs Do Not Tell You How Much Energy a Building Uses; Article 3 Eighteen Per Cent; Article 4 Mapping the Stock; Article 5 Height, Age and the Fuel Question; Article 6 The Split-Incentive Problem; Article 7 Green Leases and Service Charges; Article 8 From 38 to 73 Per Cent Energy Savings; Article 9 NABERS for Britain; Article 10 Time to Retire ECG-19; Article 11 Can London Speak for England and Wales; Article 12 The Hybrid-Work Footprint; Article 13 Why I Used Linear Regression Over Random Forest; Article 14 Vertical Postcodes; Article 15 What Is a Building?
Further reading
- Article 08: From 38 to 73 Per Cent Energy Savings: How Major UK Landlords Have Cut Office Energy in a Decade
Base-building load holding steady regardless of occupancy is precisely why landlords' operational levers, not emptier desks, drove the decade's savings; Article 08 is the adjacent instalment on those levers.
- Article 09: NABERS for Britain? Lessons from Australia on Operational Rating
Non-linear, use-driven energy change is invisible to an asset rating and only captured by measured operational rating; Article 09 makes the case for the NABERS approach the hybrid story demands.
- Article 10: Time to Retire ECG-19? Updating Office Benchmarks With Evidence From 6,000 Greater London Buildings
Hybrid work is one of the new office typologies Article 10 cites for redefining benchmarks; the changed occupancy profile is why 1992-vintage values no longer describe the stock.
Related posts
Article 13: Why I Used Linear Regression Over Random Forest on 6,000 Buildings: A Modelling Walkthrough
A series mining the PhD thesis London and UK Office Buildings: Investigating Energy Use and Landlord-Tenant Influences (Azhari, 2025). Random Forest and a simple linear regression finished in a statistical dead heat on electricity EUI, so interpretability tipped the decision to the simpler model.
Article 11: Can London Speak for England and Wales? Extrapolating Stock-Level Energy Insights
A series mining the PhD thesis on London and UK office buildings (Azhari, 2025). Key takeaway. Greater London holds 30 per cent of office floor area and 24 per cent of office premises in England and Wales, which makes it a clean proxy for some questions, a misleading one for others, and a context-dependent proxy for many.
Article 03: Eighteen Per Cent: What Building Characteristics Can and Cannot Explain About Office Energy Use
A series mining the PhD thesis on London and UK office buildings (Azhari, 2025). Key takeaway. A linear regression across the Greater London office stock explains just 18 per cent of electricity EUI and 4 per cent of gas EUI from building characteristics alone.