Assessing the Global Military Climate Footprint
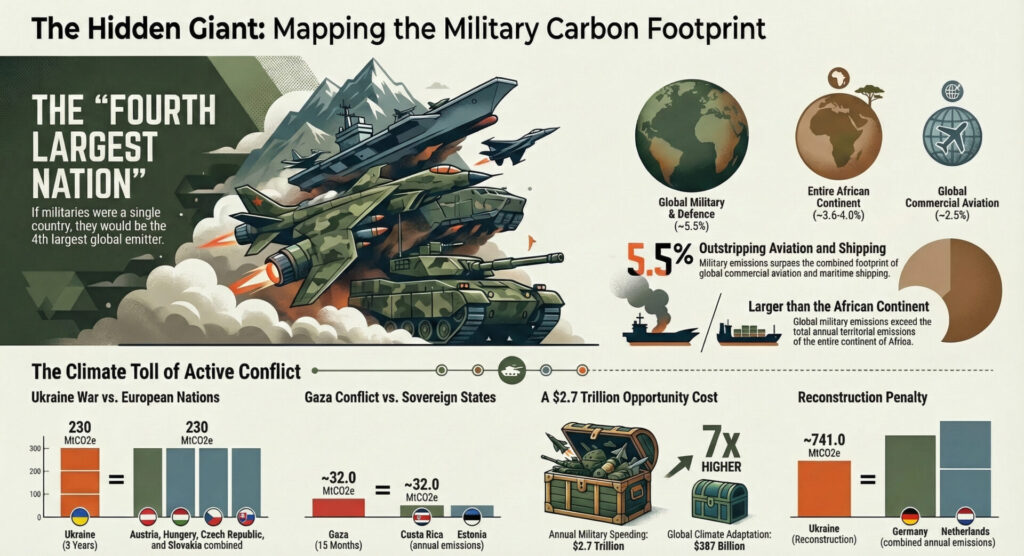
Military emissions were exempted at Kyoto and made voluntary at Paris, which leaves roughly 5.5 per cent of global emissions, some 2,750 MtCO2e a year, off the world's climate books. Reconstructed from expenditure data, that footprint would rank as the fourth-largest emitter on Earth, ahead of Russia and larger than aviation and shipping combined. This piece reads the full ledger: operations, the industrial supply chain, reconstruction, lost carbon sinks and the capital diverted from climate finance.
The Carbon Ledger of Conflict
The entries that were never made
Every national greenhouse gas inventory is a ledger, and the world's climate frameworks are built on the assumption that it is a complete one. It is not. One of the largest emitting sectors on the planet has been kept off the books for almost thirty years, shielded by geopolitical sensitivity and by the claim that national security overrides disclosure. The omission is not an accounting error. It is a structural feature of how the treaties were written, and it means the path to Net Zero is being navigated with a set of accounts that nobody has audited.
The exemptions were deliberate. During the negotiations for the 1997 Kyoto Protocol, intensive lobbying led by the US defence department secured carve-outs for military bunker fuels and for emissions generated during overseas operations (CEOBS, 2022). The 2015 Paris Agreement removed the blanket exemption and replaced it with something quieter: a voluntary reporting mechanism. Under the current framework no sovereign state is legally required to disaggregate or report military fuel consumption, which allows the “military emissions gap” to persist by default rather than by design (CEOBS, 2022). The number hiding behind that gap is large. The global military apparatus is responsible for an estimated 5.5 per cent of total global emissions, roughly 2,750 million metric tonnes of carbon dioxide equivalent (MtCO2e) each year (SGR/CEOBS, 2022). Placed against national totals, the global military footprint ranks as follows:
- China (Largest emitter)
- United States
- India
- Global Military Apparatus (2,750 MtCO2e)
- Russian Federation
Treated as a single sovereign entity, the world's combined armed forces would be the fourth-largest emitter on Earth, ahead of the entire annual output of Russia and larger than global commercial aviation and maritime shipping combined (SGR/CEOBS, 2022). That entity files no return. It sits almost entirely outside the purview of the United Nations Framework Convention on Climate Change (UNFCCC), which leaves a gap between stated climate ambition and the carbon intensity of how security is actually produced.
Reading a ledger the bookkeeper will not open
If the institutions will not publish their entries, the entries have to be reconstructed from the outside. Traditional reporting fails here because it depends on self-disclosure from bodies that treat fuel consumption as classified tactical information, or as a vulnerability an adversary could exploit. So researchers work backwards from the money (Physics World, 2026).
The primary architecture is Environmentally Extended Input-Output (EEIO) modelling, supported by Lifecycle Assessments (LCA). EEIO models map financial flows between industrial sectors and convert defence expenditure into greenhouse gas equivalents, and by combining databases such as Eora26 with the SIPRI Military Expenditure (MILEX) database it becomes possible to capture the upstream Scope 3 emissions embedded in procurement and industrial support (Physics World, 2026). The conversion factors are specific. Current models indicate a spend-emission ratio of approximately 0.000534 tCO2e per US dollar spent on military equipment (NIH, 2026). The macroeconomic relationship is equally direct: for every 1 per cent increase in the global military expenditure ratio as a share of GDP, global CO2 emission intensity rises by 0.042 kg/USD (NIH, 2026).
LCA integration adds the physical measurement that the financial modelling cannot supply, tracing a specific system from the extraction of raw materials through the manufacture of munitions to their eventual detonation. The two methods together mean that state secrecy no longer determines what is knowable. The books can be reconstructed without permission.
The operational column: fuel, flight and detonation
Modern warfare is a capital-intensive, fossil-fuel-dependent enterprise, and the shift from infantry-based combat to mechanised, high-technology operations has moved most of its emissions below the line. Direct combat is the visible entry. The logistics, basing, transport and training that make combat possible are far larger, and they are almost never posted against the war that required them. Hydrocarbon dependency is a foundational requirement for power projection, which makes major militaries the most energy-intensive institutions on the planet.
The Pentagon is the clearest illustration, and it remains the world's largest single institutional consumer of petroleum. Between 2001 and 2018 the US military emitted an estimated 1,267 MtCO2e (Crawford, 2023). Approximately 440 million metric tonnes of that total came specifically from Overseas Contingency Operations in Iraq, Afghanistan and Syria (Crawford, 2023). The 2003 invasion of Iraq alone released roughly 250 million tonnes of CO2e during its most intense kinetic phases (Anadolu, 2025).
Military aviation is a particularly potent driver of warming. With over 53,000 aircraft globally, the military fleet is significantly larger than its commercial counterpart, and it operates at altitudes where it releases not only CO2 but nitrogen oxides (NOx) and contrail cirrus cloud (CEOBS, 2025). Those non-CO2 factors disturb the atmospheric radiative balance, which means the true warming effect of a military flight is structurally higher than that of a civilian one carrying the same fuel.
Active conflicts show how fast these entries accumulate. The first twelve months of the Ukraine war saw 120 million tCO2e released, a figure that had climbed to 230 MtCO2e by the end of the third year (Climate Focus, 2024; Earth.Org, 2025). In the Middle East, the bombardment of Gaza generated 1.89 million tCO2e in fifteen months (The Guardian, 2025). Alongside these come the emissions from the deliberate destruction of energy infrastructure, of which the Nord Stream pipeline sabotage is the starkest single item, releasing 14.6 MtCO2e of methane into the Baltic (CLICCS, 2026).
The industrial multiplier: six tonnes for every one
The carbon cost of warfare extends far beyond the fuel burned in tanks and jets. Underneath it sits a supply chain multiplier that captures the emissions generated by manufacturing, maintaining and transferring armaments, and it dominates the total. Research indicates a supply chain multiplier for the military sector of approximately 5.8 (CEOBS, 2022). For every tonne of CO2 emitted in operations, nearly six tonnes are generated in the industrial process behind the hardware.
Procurement decisions therefore behave like long-dated liabilities. Once a nation commits to a fleet of aircraft such as the F-35, or to a class of warship, it is tethered to a fossil-fuel-intensive operational path for the multi-decade lifespan of that equipment. This is carbon lock-in, and it is signed for decades before it is paid.
The volume of new commitments is rising. Global military spending reached a record $2.7 trillion in 2024, and the industrial output of the arms trade is accelerating with it (SGR, 2025). The “ReArm Europe Plan” is projected to raise the military carbon footprint of EU-NATO countries to 95 MtCO2e, a 140 per cent increase over 2021 levels, driven by the energy-intensive production of high-technology munitions, autonomous drones and ballistic steel (TNI, 2024).
Transnational logistics compound the entry. The shipment of 50,000 tonnes of military supplies from the United States to Israel during the war on Gaza accounted for nearly 30 per cent of the total greenhouse gases generated in that period (The Guardian, 2025). Conflict also displaces civilian shipping: in the Red Sea, the diversion of vessels around the Cape of Good Hope has produced a significant increase in maritime fuel consumption (The Guardian, 2025). These are liabilities incurred at precisely the moment states should be decoupling from fossil fuels.
Embodied carbon and the reconstruction liability
The most delayed entry in the ledger is the destruction of the built environment. Every building, road and utility grid represents a historical investment of embodied carbon, the emissions spent extracting and assembling cement, steel and glass. When an urban centre is reduced to rubble, that investment is written off in an afternoon, and the replacement has to be paid for twice. Rebuilding draws on hard-to-abate sectors such as cement production, which releases CO2 through the chemical calcination process itself and not merely through the energy used to fire the kiln (CEOBS, 2025).
The scale of the resulting liability is considerable. In Ukraine, artillery and aerial bombardment of cities have created a structural deficit that will take years to rectify. In Gaza, the destruction of 90 per cent of the housing stock has produced 60 million tonnes of toxic debris (The Guardian, 2025). The following table sets out the projected emissions required to rebuild major conflict zones:
| Conflict Zone | Estimated Reconstruction Emissions | Primary Drivers of Emissions | Comparative Scale |
|---|---|---|---|
| Ukraine | ~741.0 MtCO2e | Cement/steel for heavy infrastructure, energy grids, and housing (over 10 years). | Equivalent to the annual emissions of Germany and the Netherlands combined. |
| Gaza | ~29.4 MtCO2e | Rubble clearance (60m tonnes), rebuilding 436,000 apartments, utilities. | Roughly equivalent to the annual emissions of New Zealand or Croatia. |
| Syria | ~22.0 MtCO2e | Housing sector reconstruction in western corridors (Aleppo, Homs, Hama). | Partial sectoral estimate (housing only). |
(Source: JICA, 2024; The Guardian, 2025; World Bank, 2025)
Note what the Syrian figure is not. It is not a national reconstruction estimate. It covers housing alone, which means the real entry for Syria is unknown and certainly larger.
The asset side: sinks that flip to debits
Warfare does not only add to one side of the ledger. It destroys the biosphere's capacity to absorb carbon, which converts a standing asset into a recurring liability. Landscape fires, tactical deforestation and the mechanical disruption of land turn natural sinks into net emission sources, and they keep emitting long after the fighting stops.
Syria is a clear case. The conflict cost the country 19.3 per cent of its forest cover between 2010 and 2019, an area of roughly 63,700 hectares (CREAF, 2024), driven by artillery-induced wildfires and by the desperate need for heating fuel among displaced populations. Globally the effect is larger still: conflict-linked vegetation fires released an estimated 1,456 MtCO2e in 2020 alone (CEOBS, 2025). Beyond forests, heavy armour and trench warfare pulverise topsoil, accelerating the depletion of soil organic carbon and driving rapid desertification in regions such as Iraq and Afghanistan (CEOBS, 2025). The deliberate destruction of hydrological systems, such as the drainage of 90 per cent of the Mesopotamian Marshes in Iraq, is the historical reminder of how quickly ecological warfare can release centuries of stored carbon.
Human capital as a written-off asset
The humanitarian consequences of war create secondary pressures that cripple long-term climate resilience. By mid-2025 an estimated 117 million people had been forcibly displaced by conflict and climate extremes (UNHCR, 2025). Displaced populations rarely have access to sustainable infrastructure, which forces a reliance on polluting diesel generators and on local timber. Aid itself carries a carbon cost: in Gaza, the 70,000 trucks required for humanitarian assistance produced 130,000 tonnes of greenhouse gases while navigating shattered road networks (The Guardian, 2025).
The more insidious loss is human capability. War destroyed the education of 242 million students in 2024, and an interrupted education is not recovered later (World Bank, 2023). It removes the technical expertise on which any Net Zero transition depends. A state emerging from conflict lacks the engineers, hydrologists, scientists and policy specialists needed to manage water resources or deploy green technology, which leaves it acutely exposed to the next climate shock and traps it in a cycle of instability and environmental degradation. A Just Transition is not available to a country that has lost the people who would have to deliver it.
Two columns, one budget
The largest systemic cost of global conflict is the one that never appears as an emission at all. It is the diversion of finite capital. In 2024 global military spending reached $2.7 trillion, while only $28 billion was successfully mobilised for climate adaptation in developing nations in 2022 (UNEP, 2022). Those two figures come out of the same constrained pool of public money, and the ratio between them is a statement of priorities that no communiqué can soften.
The consequences fall hardest on the Global South. As developed nations increase military aid and domestic defence budgets, the availability of concessional climate finance diminishes, which further strains the debt sustainability of countries already absorbing climate-induced economic shocks. Geopolitical fragmentation then disrupts energy markets and forces a reversion to high-carbon technology. The invasion of Ukraine prompted multiple European nations to recommission coal-fired power plants in the name of energy security, temporarily derailing their decarbonisation targets (CEOBS, 2025). In conflict zones such as Iraq and Libya, instability produces rampant gas flaring, which accounted for 15 per cent of global flaring emissions in 2020 (CEOBS, 2025). Security bought this way is borrowed against the climate account, and the loan is not interest-free.
What the ledger looks like beside the regulated sectors
Scale is easier to judge in comparison. The global military-industrial complex operates with a level of environmental impunity that is not extended to civilian sectors of similar or smaller size. Aviation and shipping face intense scrutiny and mandatory reduction targets under frameworks such as the ICAO's CORSIA. Military emissions remain voluntary and largely unexamined.
| Sector / Entity | Estimated Share of Global GHG Emissions | Status Under Paris Agreement / UNFCCC |
|---|---|---|
| Global Military & Defence Industry | ~5.5% | Voluntary / Often Excluded |
| Entire African Continent | ~3.6% – 4.0% | Fully Subject to NDCs |
| Global Maritime Shipping | ~1.7% – 3.0% | Regulated (IMO) |
| Global Commercial Aviation | ~2.5% | Regulated (ICAO / CORSIA) |
(Source: SGR/CEOBS, 2022; IEA, 2025; CEOBS, 2025)
The disparity is stark. The world's military apparatus produces more emissions than the entire African continent, which is home to 17 per cent of the global population and is fully subject to Nationally Determined Contributions (IEA, 2025). The 230 MtCO2e generated by the Ukraine conflict alone is equivalent to the combined annual territorial emissions of Austria, Hungary, the Czech Republic and Slovakia (Earth.Org, 2025). Military emissions are not a marginal line item. They are a dominant, unaccounted driver of the climate crisis, and the regulatory asymmetry that hides them is a policy choice rather than a technical constraint.
Closing the military emissions gap
The case for integrating military and conflict emissions into the UNFCCC framework no longer rests on argument. It rests on arithmetic. The 1.5°C target cannot be reached while the world's fourth-largest emitter operates outside any obligation to report, and no amount of civilian decarbonisation closes a gap of that size.
Three things follow. The UNFCCC should mandate transparent, disaggregated reporting of military emissions across Scopes 1, 2 and 3, which is the minimum condition for treating national inventories as accounts rather than as estimates. International mechanisms should be established to account for the carbon cost of active warfare and of post-conflict reconstruction, so that the reconstruction liability is recognised when it is incurred rather than when it is paid. And the exemptions granted at Kyoto and carried forward at Paris should be named for what they are, which is not a technical oversight but a failure of macro-financial foresight that has now compounded for nearly three decades.
Addressing the carbon cost of warfare is not an accounting requirement. It is a precondition for the credibility of everything else in the framework. A ledger with its largest liability left off the page does not become accurate because the entry is politically difficult. It simply stops being a ledger, and the world continues on a high-carbon trajectory fuelled by the very institutions charged with keeping it safe.
References
- Anadolu (2025). Wars make more carbon emissions than many countries, making humanitarian crises into environmental disasters. [online] Available at: https://www.aa.com.tr/en/environment/wars-make-more-carbon-emissions-than-many-countries-making-humanitarian-crises-into-environmental-disasters/3335737 .
- CEOBS (2022). Estimating the Military’s Global Greenhouse Gas Emissions. [online] The Conflict and Environment Observatory. Available at: https://ceobs.org/uploads/2022/11/SGRCEOBS-Estimating_Global_MIlitary_GHG_Emissions_Nov22_rev.pdf.
- CEOBS (2025). How does war contribute to climate change?. [online] Available at: https://ceobs.org/how-does-war-contribute-to-climate-change/ .
- CLICCS (2026). The Costs of Military Spending, Wars and the Plausibility of Climate Futures. [online] Available at: https://www.cliccs.uni-hamburg.de/publications/hamburg-climate-futures-outlook/fact-sheets/box2-/outlook-24-box-2.pdf .
- Climate Focus (2024). Climate damage caused by Russia’s war in Ukraine. [online] Available at: https://climatefocus.com/publications/climate-damage-caused-by-russias-war-in-ukraine/ .
- Crawford, N.C. (2023). Pentagon Fuel Use, Climate Change, and the Costs of War. [online] Watson Institute, Brown University. Available at: https://costsofwar.watson.brown.edu/sites/default/files/papers/Crawford-Pentagon-Fuel-Use-Climate-Change.pdf .
- CREAF (2024). The war in Syria has wiped out 19% of the country’s forests. [online] Available at: https://www.creaf.cat/en/articles/war-syria-has-wiped-out-19-countrys-forests-equivalent-entire-metropolitan-area-barcelona .
- Earth.Org (2025). 3 Years On, War Is Largest Source of Carbon Emissions in Ukraine. [online] Available at: https://earth.org/warfare-now-largest-source-of-ukraines-annual-carbon-emissions-report-warns-on-third-anniversary-of-russias-invasion/ .
- IEA (2024). Aviation. [online] International Energy Agency. Available at: https://www.iea.org/energy-system/transport/aviation.
- IEA (2025). Africa: Countries & Regions. [online] Available at: https://www.iea.org/regions/africa/emissions .
- JICA (2024). Estimating the Carbon Footprint of Post-War Reconstruction: Toward a “Greener” Recovery of Ukraine. [online] Available at: https://www.jica.go.jp/english/jica_ri/publication/discussion/__icsFiles/afieldfile/2024/09/04/Discussion_Paper_No.24.pdf.
- NIH (2026). Rising military spending jeopardizes climate targets. [online] PMC. Available at: https://pmc.ncbi.nlm.nih.gov/articles/PMC12098794/ .
- Physics World (2026). The environmental and climate cost of war. [online] Available at: https://physicsworld.com/a/the-environmental-and-climate-cost-of-war/.
- SGR/CEOBS (2022). Estimating the Military’s Global Greenhouse Gas Emissions. [online] Available at: https://ceobs.org/uploads/2022/11/SGRCEOBS-Estimating_Global_MIlitary_GHG_Emissions_Nov22_rev.pdf .
- SGR (2025). Military spending rises and greenhouse gas emissions: What does the research say?. [online] Available at: https://www.sgr.org.uk/sites/default/files/2025-09/SGR_MilEx_GHGs_WEB.pdf .
- The Guardian (2025). Carbon footprint of Israel’s war on Gaza exceeds that of many entire countries. [online] Available at: https://www.theguardian.com/world/2025/may/30/carbon-footprint-of-israels-war-on-gaza-exceeds-that-of-many-entire-countries.
- TNI (2024). Climate in the Crosshairs: The planetary impact of NATO’s spending increases. [online] Transnational Institute. Available at: https://www.tni.org/en/publication/climate-in-the-crosshairs.
- UNEP (2022). Contribution of Military and War to Global Emissions. [online] CEDARE. Available at: https://2025.cedare.org/contribution-of-military-and-war-to-global-emissions-2/ .
- UNHCR (2025). UNHCR report reveals extreme weather driving repeated displacement. [online] Available at: https://www.unhcr.org/us/news/press-releases/unhcr-report-reveals-extreme-weather-driving-repeated-displacement-among .
- World Bank (2023). The Human Capital Losses of the War in Ukraine. [online] Available at: https://thedocs.worldbank.org/en/doc/5c9598063f47f2c96935621be315173b-0140062023/original/The-War-in-Ukraine-and-Human-Capital-Losses.pdf .
- World Bank (2025). The Syrian Conflict: Physical Damage and Reconstruction Assessment. [online] Available at: https://documents1.worldbank.org/curated/en/099102025095540101/pdf/P510947-f30bd5f6-78d5-4712-9f1e-a558b5c8ba75.pdf .
Chart
Estimated reconstruction emissions by conflict zone
Cement and steel for housing, grids and infrastructure dominate.
Further reading
- Syria's Polycrisis: Integrating Environmental Justice and Green Reconstruction for a Resilient Future
Direct extension of the conflict-climate nexus: the military-emissions and destroyed-carbon-sink argument is the global frame for Syria's specific war-and-climate polycrisis.
- The Hidden Flaw in the World’s Biggest Corporate Climate Plan
Both expose a structural reporting loophole in the carbon-accounting regime (Scope omission / military exemption) that makes Net Zero claims unsound; same critique of treaty-level accounting gaps.
- World's Top Courts Issue Landmark Rulings on Climate Change
The article's call for mandatory disaggregated reporting connects to the binding UNFCCC/state-duty obligations established by the ICJ and ITLOS advisory opinions.
Related posts
ScenarioMIP CMIP7: What Changes and What It Means for Finance and the Built Environment
An analysis of the new ScenarioMIP design for CMIP7 (Van Vuuren et al., 2026), and what it means for science, disclosure standards, banks, lenders and real estate..
Carbon Offsets: A Flawed Solution, According to New Research?
Carbon Offsets: A Flawed Solution, According to New Research For years, carbon offsetting has been promoted as a key tool in the fight against climate change. The concept is simple: compensate for emissions by investing in projects that reduce or remove greenhouse gases elsewhere. However, a comprehensive research paper by Joseph Romm, Stephen Lezak, and
The Sustainability Professional’s Guide to Asset Allocation
The New Pragmatism in Capital Allocation The transition from 2024 to 2026 has marked a quiet but profound revolution in the corridors of global finance. If the early 2020s were defined by the enthusiastic, often imprecise, language of “ESG” (Environmental, Social, and Governance) pledges and carbon-neutral targets, the current era is defined by a rigorous,