Your Backtest Is Not Evidence: Why Retail Quant Systems Die Before They Trade
A beautiful equity curve is the default outcome of a backtest, not an achievement. Here is why every retail quant failure mode is biased toward optimism, and the one habit that survives contact with a live market: suspicion over celebration.
Give a motivated developer a data feed, an optimiser and a few free weekends, and they will produce a Sharpe ratio of 2 almost every time. The equity curve will climb from the bottom left to the top right, the drawdowns will look survivable, and the whole thing will feel like a discovery. It is not. A beautiful backtest is the default outcome of the exercise, not the achievement. The achievement, and it is a rare one, is knowing whether the curve means anything at all before you fund it with real money.
This is the single idea to internalise before any formula, any library, any broker connection: every number a backtest produces is biased toward optimism until you have proven otherwise. The errors are not random noise scattered evenly around the truth. They lean, systematically, in the flattering direction. And they lean that way for a reason that is almost psychological: the optimistic mistakes are the ones that survive your attention, because a strategy that suddenly looks worse gets deleted, while a strategy that suddenly looks better gets a name, a config file, and a slice of your savings.
I learned this the expensive way, building and running a real multi-strategy system (I will call it Titan throughout) that trades live through a retail broker. Titan has fallen into every hole below at least once. This piece is the map of those holes, and the argument for the posture that keeps you out of them.
The four failures are one property wearing four costumes
Most write-ups treat the ways a quant system dies as a checklist: overfitting, look-ahead bias, no risk management, no operations. Tick each box and you are safe. That framing quietly misleads, because it hides the thing the four have in common, which is the only thing worth remembering.
Figure
The four ways a retail quant system dies before the market votes
Each mode biases the result toward optimism, so the mistakes that survive your attention are exactly the ones that get funded.
- 1
Overfitting and multiple testing
An edge selected by luck across many trials; it evaporates live.
- 2
Look-ahead bias
The code quietly used information it could not have had in time.
- 3
No risk layer, no survival maths
Nothing caps the loss on the day the edge is wrong.
- 4
No operations
The order rejects, the data corrupts, and the real edge never runs correctly.
Every failure flatters the strategy. That asymmetry is the whole reason for suspicion.
Look at them not as four separate bugs but as four expressions of a single property: each one makes the strategy look better than it is. That is not a coincidence of my particular system. It is structural. A backtest is a measurement, and in this domain the measurement apparatus is rigged toward good news.
- Overfitting and multiple testing flatter you by selecting an edge that was never there. Search enough parameters, instruments and windows and one combination will look brilliant by pure chance. Your search process then guarantees you pick exactly that one. The more cells in the grid, the higher the expected best result even when every single strategy is genuinely worthless.
- Look-ahead bias flatters you by letting the strategy trade on information it could not have had in time. The canonical version decides a position using a bar and then earns that same bar's return. It reads like perfectly ordinary code, which is exactly why it survives review and manufactures a plausible, and completely fake, equity curve.
- No risk layer flatters you by hiding the path. Sharpe ratio, the number everyone optimises, is blind to the two things that actually end accounts: the depth of the worst drawdown and the fatness of the loss tail. A strategy can be excellent on average and still bankrupt you on the way to the average.
- No operations flatters you by never letting the real edge run. The order rejects, the container dies at 3am, the cost model was fiction, the data feed silently corrupts, and none of it shows up as a wrong number on a chart. It shows up as an account that quietly does nothing, or the wrong thing.
Once you see the shared property, the defence stops being a checklist and becomes a stance. You do not ask "did I remember to check for look-ahead?" You ask, of every green result, "which direction is this lying in, and how would I catch it?"
A war story, because the property is easier to feel than to state
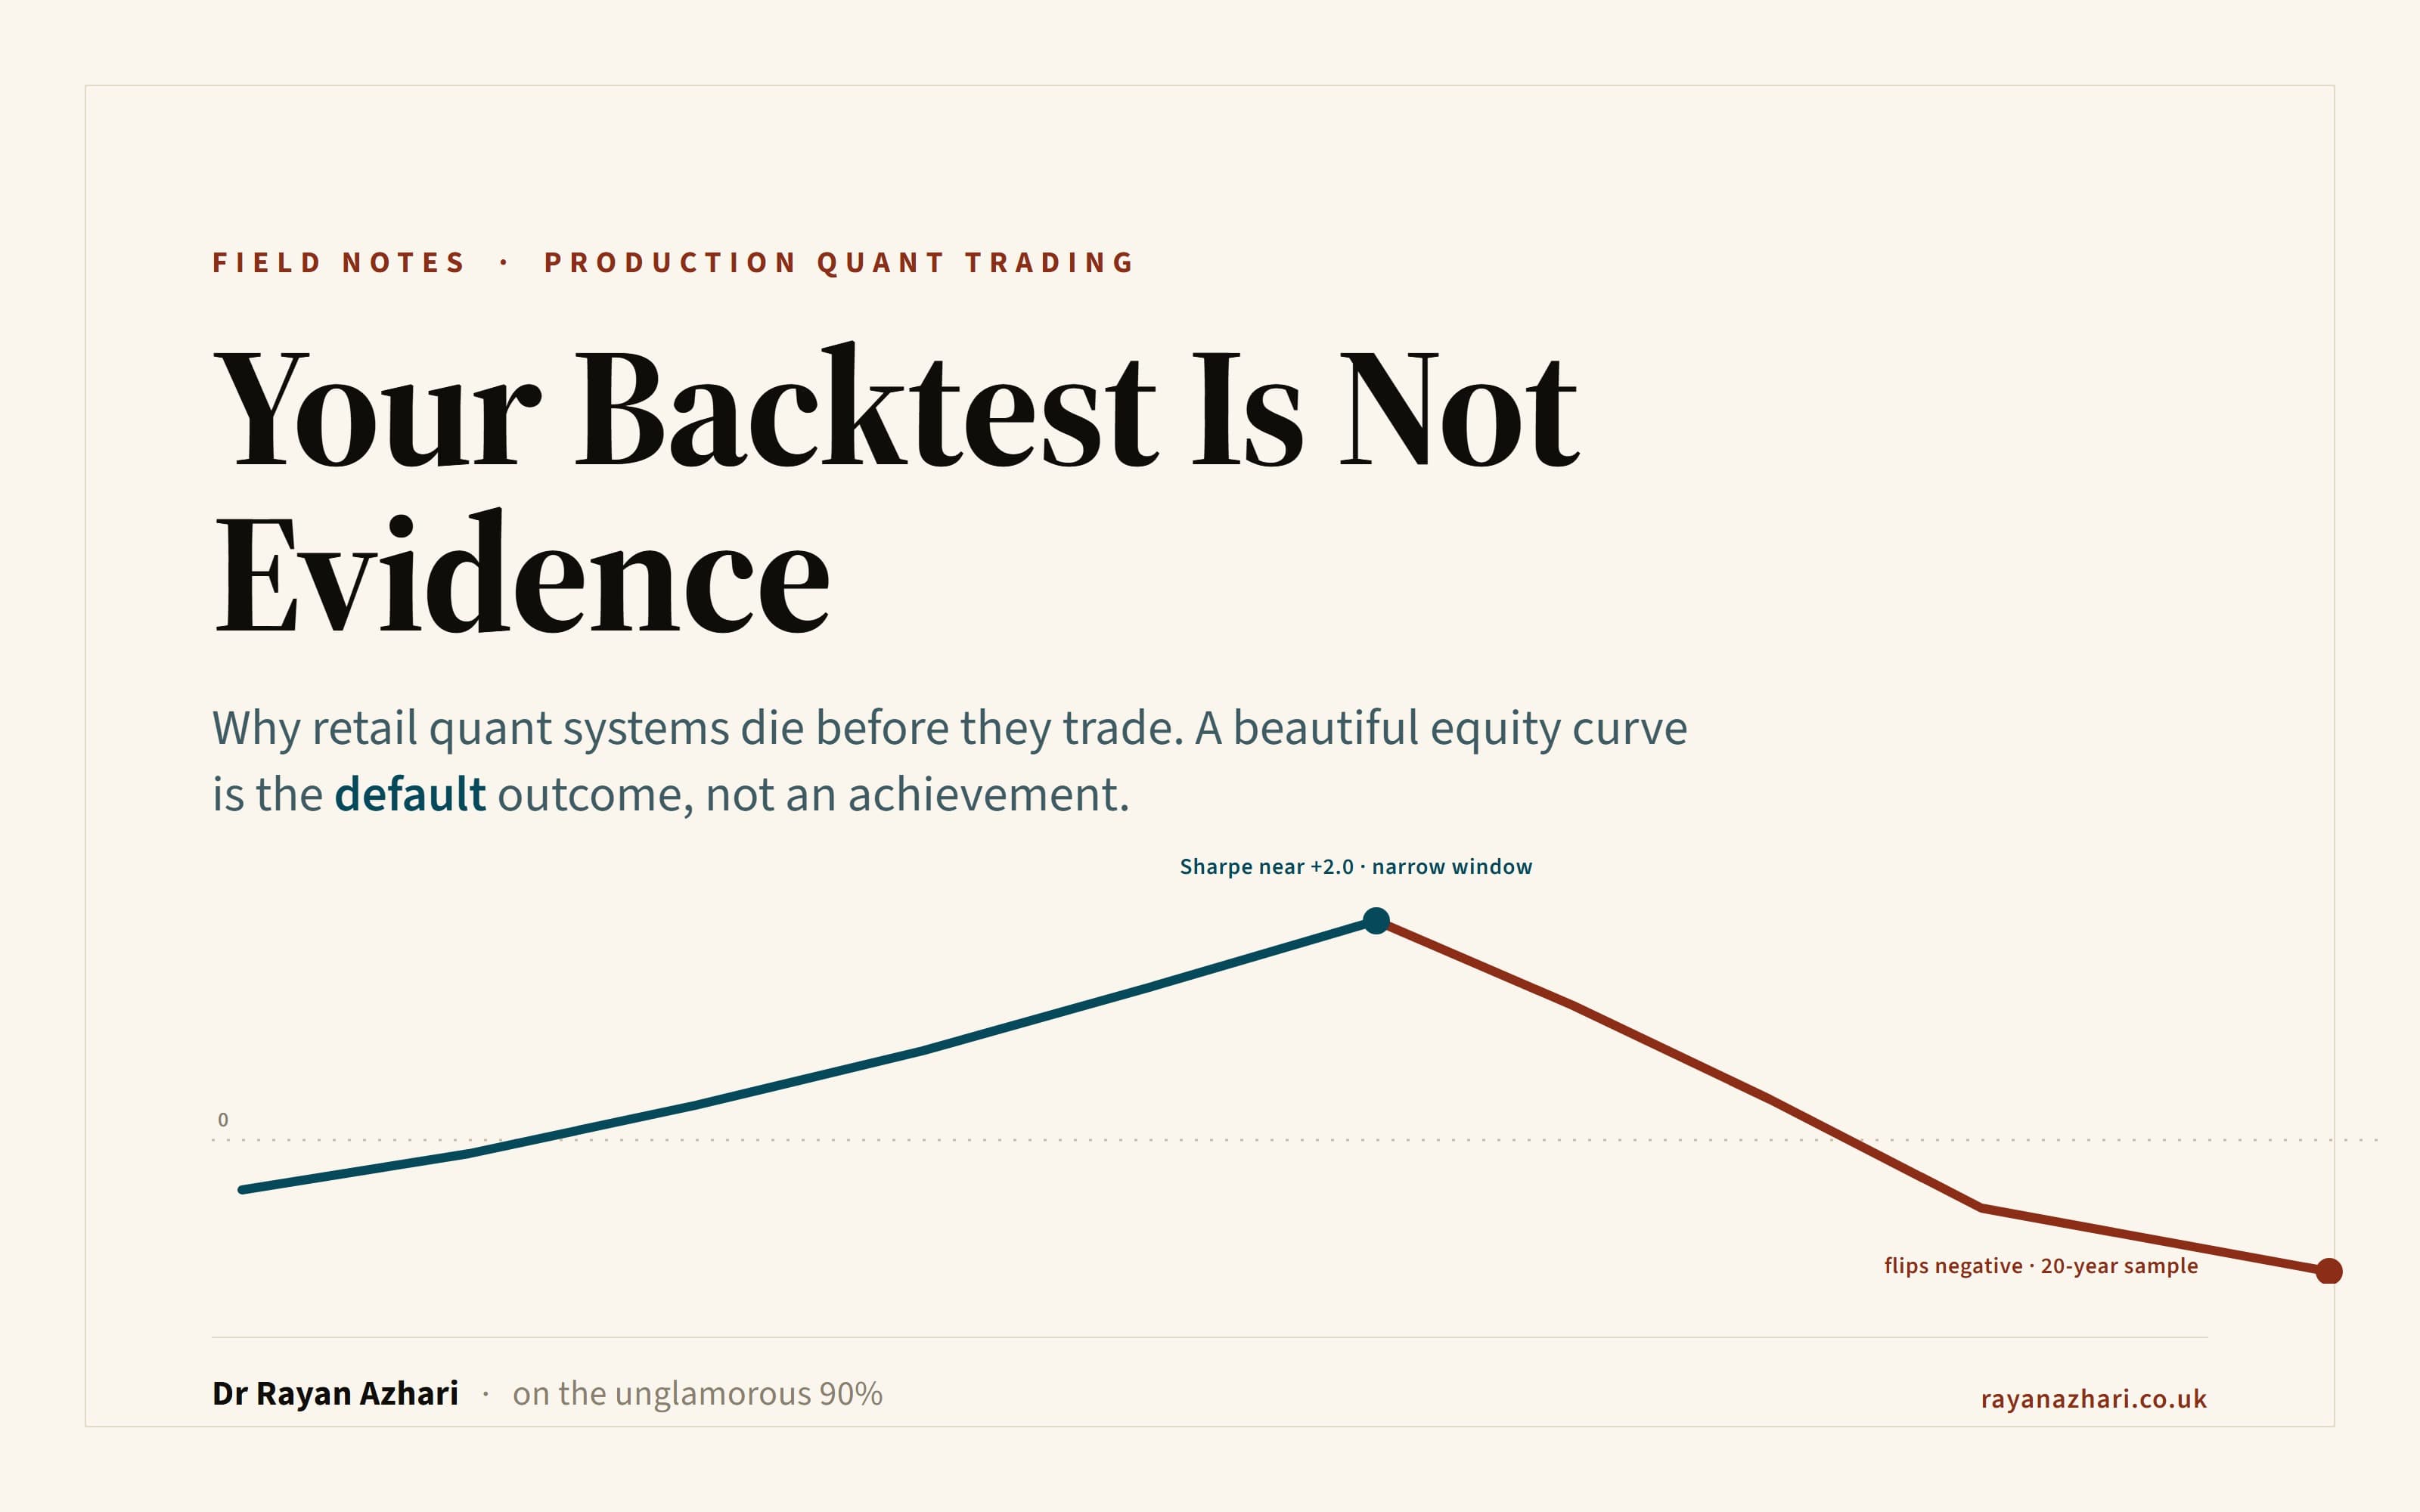
A trend-following ensemble I was testing produced a Sharpe near +2.0 on a narrow, recent window: a few years, one asset class. It even passed a robustness check. Nudging the parameters barely moved the result, so it looked like a real, stable edge rather than a fluke. Every instinct said deploy.
Then I ran the identical specification on a much broader universe and roughly twenty years of history. The Sharpe flipped negative.
Chart
The same trend strategy, two samples
A trend ensemble scored a Sharpe near +2.0 on a narrow, recent window, then flipped negative on a broad, twenty-year sample. Illustrative and sanitised, not a live result.
The +2.0 was never a trend edge. It was one lucky sub-regime, sampled with too few independent periods for the statistics to notice. The dangerous part is not that the strategy was bad. Plenty of strategies are bad. The dangerous part is that on the narrow window it looked good and stable at the same time, which is precisely the combination that gets funded. The only thing that saved the money was refusing to trust the point estimate and insisting on a broader, longer test the search had never touched.
That is the whole discipline in one anecdote. The number was optimistic. The optimism was invisible on the data I first looked at. And the only cure was an independent check that asked the question my eye had already skipped.
Optimise the lower bound, not the point estimate
Here is the practical rule that falls out of "every number is optimistic." If a backtest hands you a single Sharpe of 1.2, that figure is the most flattering reading of your search, not a neutral estimate of the future. The honest question is not "how good does this look?" but "how bad could this plausibly be, and can I still live with it?"
So you stop reporting point estimates and start reporting lower bounds. A bootstrap confidence interval on the Sharpe tells you how badly the strategy could realistically underperform its headline. If the lower bound sits at or below zero, the strategy is a coin flip with a good story, no matter how shiny the point estimate. It does not get funded. And the trial count that goes into deflating that number is the size of your whole search pool, not the handful of survivors you are proud of. Counting only the winners understates how hard you searched, which understates how lucky the winner probably got.
This single move, judging the conservative bound rather than the seductive centre, reorganises everything downstream. It is why a strategy with a lower headline Sharpe but a tighter, cleaner interval can be the better bet than a spectacular number whose interval plunges through zero.
The portable version: a four-gate promotion spine
If you take one artefact from this piece, take this. Before any strategy is allowed near live capital, it clears four gates, one per failure mode. A blank on any line caps the verdict at "unconfirmed", which means the result does not exist yet, not that it is bad.
- Overfitting gate. The deflated Sharpe, computed against the full search pool, is positive, and the winner sits on a plateau (neighbouring parameters give similar results), not a spike (a knife-edge in the noise).
- Look-ahead gate. An independent causality test passes end to end. My favourite is brutally simple: corrupt every price after some date, then assert that nothing computed before that date changes. If the past moves when you poison the future, the strategy is reading ahead.
- Survival gate. Return per unit of drawdown (Calmar), measured relative to simply holding the underlying, is positive, and the risk of ruin at your deployed size is acceptable. Average return does not appear on this line, on purpose.
- Operations gate. Fills are verified against a real or realistic broker, not assumed from the backtest blotter. The cost model is calibrated against actual fills, including the commission floor and the slippage a close-fill backtest ignores.
Pin it above the desk. Notice what it is not: it is not advice about what to trade. It is a set of gates about whether you are allowed to believe your own results yet. That distinction is the entire book these essays come from.
Why external gates beat careful reading
Every war story I have from Titan, the +2.0 phantom, a look-ahead leak that appeared in four separate places in one codebase, a defensive switch that was silently disabled through an entire crisis because it compared a live asset against a frozen snapshot, has one thing in common. None of them was caught by re-reading the code.
Each fell to an independent check: a broader sample, a corrupt-the-future assertion, a synthetic stress path that forced the switch to fire. That is not an accident either. You cannot proofread your way out of a bias you cannot see, because the same blind spot that wrote the bug reads the review. The whole point of gates, bootstraps and held-out data is to ask the question your attention has already decided to skip.
This is why the unglamorous 90% of building a trading system, the validation, the risk layer, the plumbing, decides whether an edge survives, far more than the cleverness of the edge itself. Finding a candidate signal is the first 10%. Proving it is real, sizing it so a bad month does not end you, and running it as a process that survives your own future mistakes is the rest.
If you want the mechanism behind each gate, the full first chapter, Why most retail quant systems fail, is free to read and goes through all four holes with the code and the fixes. This essay is the argument for the posture; that chapter is how you implement it. That chapter is also the free opening of Building a Production Quant Trading System; the complete book, a living digital copy on Leanpub and a print paperback on Amazon, carries the paid half on sizing, portfolio construction and running the system live.
Carry one sentence out of here: a green backtest is a claim to be stress-tested, never a result to be banked. Suspicion over celebration.
This is an engineering essay, not investment advice, and it contains no tradable strategy. All figures are illustrative and sanitised.
Figure
The four ways a retail quant system dies before the market votes
Each mode biases the result toward optimism, so the mistakes that survive your attention are exactly the ones that get funded.
- 1
Overfitting and multiple testing
An edge selected by luck across many trials; it evaporates live.
- 2
Look-ahead bias
The code quietly used information it could not have had in time.
- 3
No risk layer, no survival maths
Nothing caps the loss on the day the edge is wrong.
- 4
No operations
The order rejects, the data corrupts, and the real edge never runs correctly.
Every failure flatters the strategy. That asymmetry is the whole reason for suspicion.
Chart
The same trend strategy, two samples
A trend ensemble scored a Sharpe near +2.0 on a narrow, recent window, then flipped negative on a broad, twenty-year sample. Illustrative and sanitised, not a live result.
Further reading
- Suspicion Over Celebration: Inside "Building a Production Quant Trading System"
This essay argues the posture; the book review lays out the full practitioner's guide it comes from, its structure, and what to expect (and not expect).
Related posts
Never Use Float For Money: The Bug That Silently Mis-Sizes Live Trades
Using a floating-point number for money is a classic bug, but in a trading system it does not just round a penny wrong: it silently mis-sizes a live position. Here is why, and why a Money type is not the fix you think it is.
Bar Timestamp Convention: The Open vs Close Stamp That Leaks a Full Bar of Look-Ahead
A bar carries one timestamp, but that stamp is ambiguous: is a bar labelled 09:00 the open of the coming interval or the close of the last one? Vendors disagree, and reading the wrong edge is a clean one-bar look-ahead that sails through review. Here is the war-story, why the leak is invisible, and the ingest rule I now enforce on every feed.
Adjusted vs Unadjusted Close: The Dividend Double-Count That Fakes a Backtest Edge
Total-return and price-return series look identical on a chart and differ by percent-per-year underneath. Mix them, or fold dividends in twice, and a long-horizon backtest drifts a few percent above the honest one every year and compounds into a phantom edge. Here is the reconstruction check I now run: rebuild total return from price plus the dividend stream yourself and diff it against the vendor's adjusted series.