Risk of Ruin Monte Carlo: Resample the Cause, Not the Effect
Most risk-of-ruin Monte Carlo resamples a strategy's realised P&L, which quietly bakes in the good luck you are trying to stress and understates the tail. Here is the correction that made my honest drawdown distribution far fatter than my first one, plus the relative gate a long-only sleeve actually needs. First person, British English, illustrative numbers only.
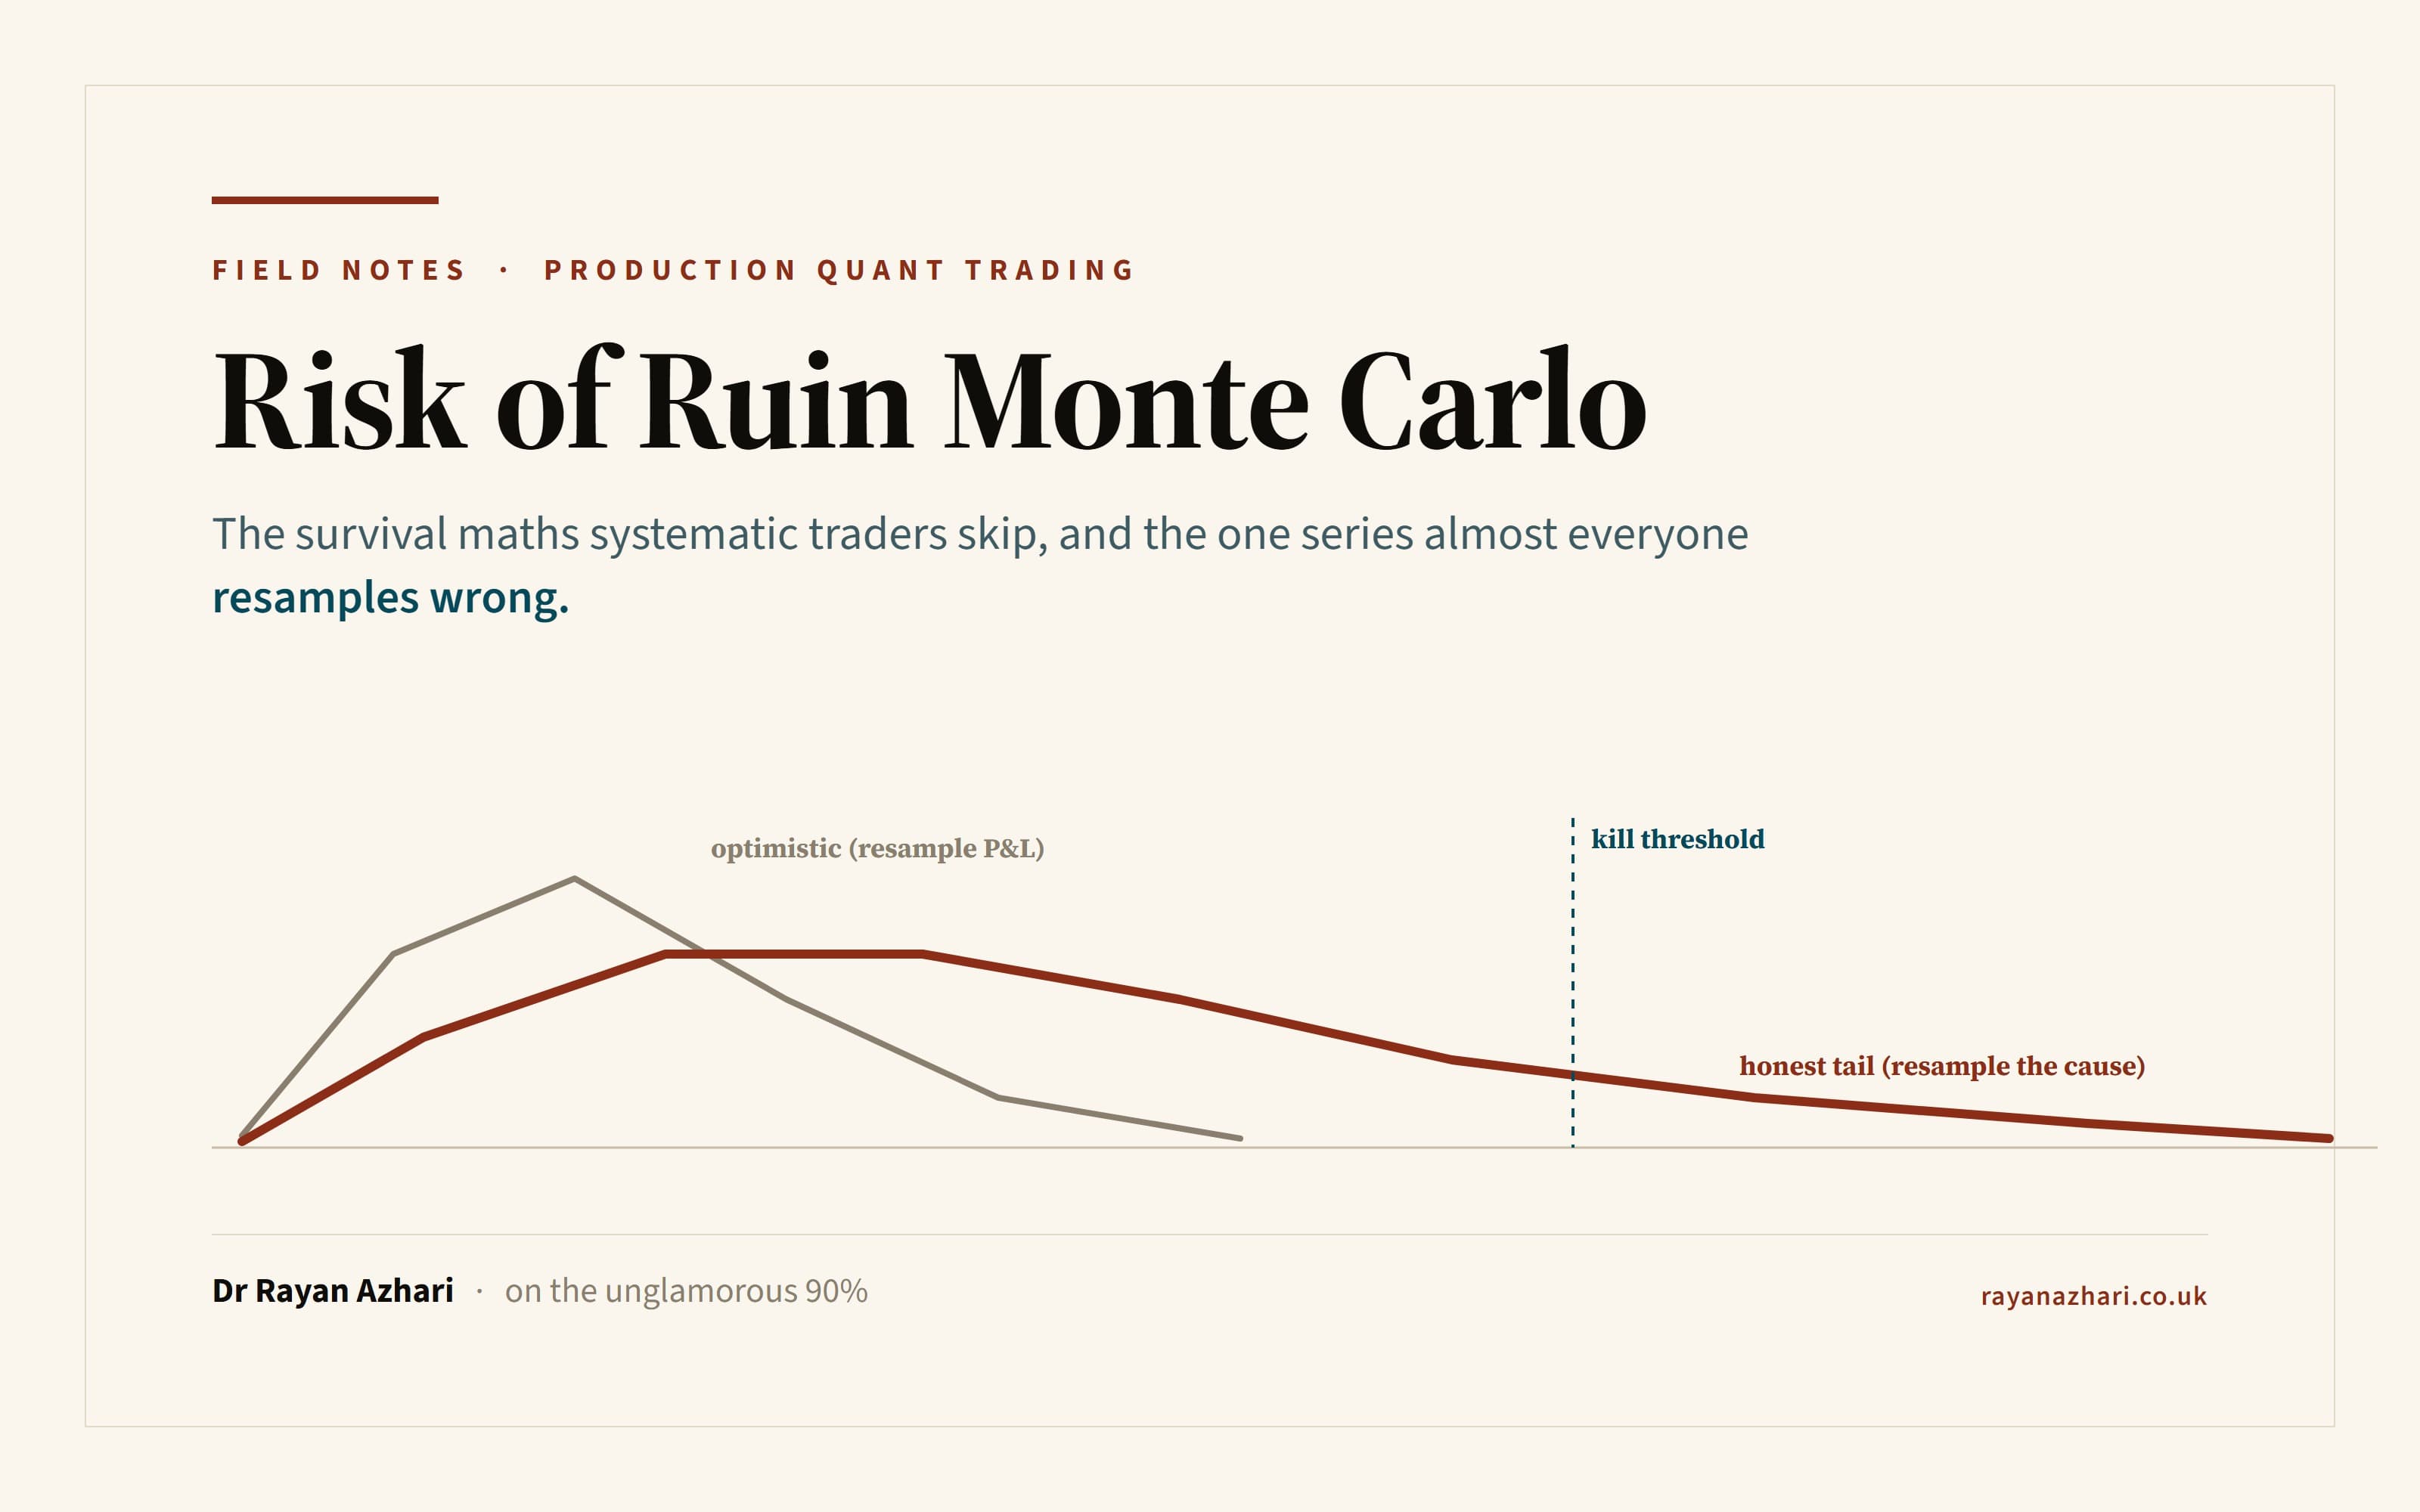
My first risk-of-ruin number for Titan was a comforting little decimal. I had block-bootstrapped the strategy's own return series, run a thousand synthetic paths, counted how many breached my kill threshold, and read off a probability of ruin that was small enough to sleep on. It felt rigorous. There was a Monte Carlo. There were a thousand paths. There was a percentile. Then an external audit asked one question that dismantled the whole thing: what series are you resampling? I was resampling the wrong one, and the honest redo handed me a drawdown tail several times fatter than the one I had been about to deploy on.
That is the trap this piece is about, because almost every risk-of-ruin write-up I have read falls into it. The survival maths is the part systematic traders skip, and when they do reach for it, they reach for the seductive, cheap version that flatters them. The single idea to carry out of here is this: a risk-of-ruin Monte Carlo must resample the cause, not the effect. Resample the effect and you are stress-testing a world your strategy already survived.
The strategy's returns are an effect, not a world
Here is the mechanics of why my first number was a fiction. A strategy's realised return series is not raw data about the market. It is the output of your logic, entries, exits, stops, filters, sizing, colliding with one particular price path that happened to occur. It is an effect. The stops already fired at the historical moments they fired. The regime filter already sidestepped the worst entries it was ever going to sidestep. Every drawdown in that series is one the strategy already navigated and lived through.
So when you block-bootstrap that series, reshuffling chunks of realised P&L, you are drawing from a distribution of outcomes your strategy has already proven it can survive. The worst synthetic path you can possibly construct is bounded by the worst historical path, because you are only ever rearranging blocks the strategy already handled. You cannot manufacture a drawdown it never produced. You learn how variable the outcome was. You learn nothing about how variable the world is, which is the only thing risk of ruin is supposed to measure.
This is exactly the optimism bias that runs through every failure mode in systematic trading: the flattering mistake is the one that survives your attention, because a scarier number gets re-examined and a comfortable one gets banked. Resampling the effect is optimism dressed as diligence. It has a thousand paths and a percentile, and it is still measuring the wrong quantity.
Chart
Resample the cause, not the effect
Max-drawdown distributions from 1,000 synthetic paths. Resampling realised P&L (optimistic) dies off early; resampling the underlying and re-running the strategy (honest) has a far fatter tail. Illustrative and sanitised.
Resample the cause: rebuild the price, re-run the strategy
The honest construction changes what you feed the bootstrap. Instead of resampling the strategy's P&L, you resample the underlying instrument's returns, the raw data-generating process, then rebuild a synthetic price path from those resampled returns (cumprod them back up into a price), and then re-run the entire strategy on each synthetic path exactly as it ran in the backtest: same entries, same stops, same filters, same cost model.
Now the strategy meets price sequences it has never seen. A stop gets gapped straight through because the synthetic path jumped where the real one drifted. The regime filter waves a loser in because the synthetic sequence looked benign right up to the reversal. A trend flips one bar after entry. None of these were in the historical record, so none of them could ever appear in a resample of realised P&L, and all of them appear naturally the moment you resample the cause and let the strategy make fresh mistakes against fresh data. The drawdown distribution you get out is the distribution of what your strategy would do under stress, not a reshuffling of how it already did.
Two structural details make this trustworthy rather than merely different.
First, preserve the serial structure. You do not resample individual bars independently; an IID shuffle destroys the autocorrelation that trend and carry strategies actually live on, and hands you a fantasy market with no momentum and no clustering. You resample in blocks. My default for a deploy-critical tail is a stationary block bootstrap (Politis and Romano's scheme, with randomised block lengths and a circular wrap) rather than fixed-length blocks, because fixed boundaries systematically under-represent the clustered, multi-week grind that is precisely the drawdown that hurts. When the decision hinges on the tail, pick the scheme that is honest about clustering.
Second, carry the full cost and financing model onto the synthetic path. On a synthetic price your commissions, slippage and overnight carry are modelled, not observed, so they inherit the backtest's cost assumptions. Skip them and you feed a gross-of-cost drawdown distribution into a ruin gate whose input is meant to be net of cost, and the two sit on different footings. The run understates ruin again, this time through the back door.
There is an honest cost to all this, and I will not pretend otherwise: re-running a real strategy across a thousand multi-year synthetic histories is minutes to hours, not seconds, and a strategy that depends on volume, spread or multiple instruments is not a function of one price column at all. You have to structure the strategy so it can be re-run headless on a synthetic frame, and for a cross-asset sleeve you resample every leg at the same block indices so the cross-correlation survives the resample. The convenience of resampling realised P&L is real. It is also the whole reason the number it produces is wrong.
The second correction: a long-only tail gate must be relative
Once I was resampling the cause, I hit the mistake that catches everyone on the next step: I put an absolute gate on the drawdown distribution. Something like "the probability of a max drawdown worse than X% must stay below some small p." That gate is correct for a market-neutral or tactical sleeve. It is nonsense for a long-only one, and here is why.
When you block-bootstrap twenty years of a real index, you are shuffling real crisis bars into most of your synthetic paths. So the underlying itself blows through an absolute drawdown ceiling on a large fraction of paths. If the market fails your absolute gate, then your gate is not testing your strategy at all. It is testing whether the asset class had crises in it, and it did, so the gate just tells you the twentieth century happened.
The economically correct question for anything long-only is relative: on each synthetic path, run the strategy and a buy-and-hold benchmark, and ask whether the strategy drew down less than simply holding the underlying on that same path. You gate on the ratio of their drawdowns, median ratio below one and the strategy no worse on a majority of paths, not on an absolute ceiling the market itself cannot clear. The rule sorts cleanly: use the absolute gate for market-neutral and tactical strategies, and the relative gate for anything whose entire thesis is "I add defensive value over the underlying." Point an absolute gate at a defensive sleeve and you will reject a strategy for the sin of being invested in a market that has bad years.
Figure
Match the gate to the sleeve
Why a long-only tail gate must be relative, not absolute.
Absolute gate
wrong for long-only
Block-bootstrapping real crisis bars makes buy-and-hold itself breach an absolute drawdown ceiling on many paths, so the gate tests whether the asset class had crises, not whether your strategy is safe.
Relative gate
correct for long-only
On each synthetic path, run the strategy and buy-and-hold, and ask whether the strategy drew down less. Gate on the drawdown ratio below one, not on a ceiling the market itself cannot clear.
A gate the market cannot pass is not measuring your strategy.
From drawdown to ruin, and a caution on the number
A drawdown distribution is still only a proxy. Risk of ruin is the operationally useful event: the probability that your portfolio kill switch trips within a specific deployment horizon, at a specific weight. A frightening standalone drawdown can be perfectly safe at a small weight, and a mild one can be lethal if it is the whole book and the kill switch sits just below its typical trough. So you take the honest, cause-resampled returns, scale them to the weight you actually deploy at, forward-simulate over the horizon you actually deploy across, and count the fraction of paths that cross the kill line.
An illustration, and I want to be explicit that these numbers are invented to show the mechanism, not lifted from my live book: suppose at a 15% deployment weight over a one-year horizon, 5 of 1,000 paths breach a kill threshold, so your ruin estimate is 0.5%. Push the same edge to a 40% weight and perhaps 55 paths breach, so the estimate is 5.5%. Same strategy, same edge, an order of magnitude more ruin, purely because ruin scales with deployed size and not just with the quality of the signal.
And treat that small probability with suspicion. Five events in a thousand paths is a wide binomial interval; a gate set at a tenth of a percent, decided by one or two paths, is a coin flip, not a measurement. Re-run across seeds and treat any near-threshold ruin number as un-measured rather than passed. A false-precise risk number is worse than no number, because it carries its false confidence straight into a deploy decision.
The portable artefact
If you keep two rules from this, keep these.
Bootstrap the cause, not the effect. Never resample a strategy's realised P&L to estimate its tail. Resample the underlying's returns, rebuild a synthetic price, and re-run the full strategy (with its real cost model) on each path, in stationary blocks that preserve the autocorrelation the edge lives on. The realised-P&L version is cheaper and it is systematically optimistic; the redo will almost always hand you a fatter, truer tail.
Match the gate to the sleeve. Absolute drawdown ceilings for market-neutral and tactical strategies; a relative, versus-buy-and-hold gate for long-only and defensive sleeves, because block-bootstrapping real crisis bars makes the underlying itself fail an absolute test. A gate the market cannot pass is not measuring your strategy.
Pin both above the desk. Neither tells you what to trade. They tell you whether you are allowed to believe your own survival number yet, which is the only number that decides whether the business is still here next year.
The full method, the three bootstrap flavours, the joint-ruin extension across a whole book, and the stressed version where diversification collapses toward one in a crisis, is in the chapter these notes come from. Tail risk and risk of ruin is free to read, with the code and the gates laid out end to end. That chapter is part of Building a Production Quant Trading System; the complete book, a living digital copy on Leanpub and a print paperback on Amazon, adds the paid half: sizing, portfolio construction and running the thing live. If you want these field notes as they publish, the newsletter is the place; this essay is the argument, the chapter is the implementation.
This is an engineering essay, not investment advice, and it contains no tradable strategy. All figures are illustrative and sanitised, and the war-stories are about bugs and losses, never profits.
Chart
Resample the cause, not the effect
Max-drawdown distributions from 1,000 synthetic paths. Resampling realised P&L (optimistic) dies off early; resampling the underlying and re-running the strategy (honest) has a far fatter tail. Illustrative and sanitised.
Figure
Match the gate to the sleeve
Why a long-only tail gate must be relative, not absolute.
Absolute gate
wrong for long-only
Block-bootstrapping real crisis bars makes buy-and-hold itself breach an absolute drawdown ceiling on many paths, so the gate tests whether the asset class had crises, not whether your strategy is safe.
Relative gate
correct for long-only
On each synthetic path, run the strategy and buy-and-hold, and ask whether the strategy drew down less. Gate on the drawdown ratio below one, not on a ceiling the market itself cannot clear.
A gate the market cannot pass is not measuring your strategy.
Further reading
- Your Backtest Is Not Evidence: Why Retail Quant Systems Die Before They Trade
The manifesto: resampling the effect instead of the cause is optimism dressed as diligence, the same bias the whole posture guards against.
- Suspicion Over Celebration: Inside "Building a Production Quant Trading System"
Tail risk and risk of ruin is one chapter of the free half; the book review lays out the full guide.
Related posts
Sharpe Ratio Limitations: Why I Promote on Calmar, Not Sharpe
A candidate in my Titan system posted a Sharpe near 1.4, cleared every statistical gate, and still traced a drawdown so deep and so long that I could never have held it through the trough. Here is why Sharpe is blind to the path and the tail, the survival-metric suite (Sortino, Calmar, CVaR, CDaR) that sees what it misses, and the one rule it bought me: promote on Calmar lift, not Sharpe lift. All figures are illustrative and sanitised.
Walk Forward Optimization Is Not Automatically Out of Sample
Everyone sells walk-forward validation as proof a strategy is out-of-sample. It is not. I ran my own walk-forward pipeline on pure random-walk noise and it still produced a healthy positive stitched Sharpe, because out-of-sample is a property of provenance, not partitioning. Here is the random-walk control that tells you whether your pipeline, or your edge, produced the number.
Fail Closed Data Validation: Why a Trading Bot Should Refuse to Boot on Bad Data
A data-quality gate that crash-loops on corrupt, stale or all-NaN data is not broken, it is working: the alternative is fail open, trading on garbage with silent defaults. Here is the war-story from both sides, the honest flip where an over-eager gate locked me out of a market, and the one portable rule: on bad data, refuse to trade and alert loudly, never proceed with a default that looks like data.