Live Trading Does Not Match the Backtest: The Code-Level Causes Nobody Names
When your live P&L drifts from the backtest you validated, the culprit is almost never psychology. It is code: the same metric computed two subtly different ways in research and in the live sizing path. Here is the parity oracle I now gate on, and the deeper rule behind it: live and research must call the same code, not two copies of it.
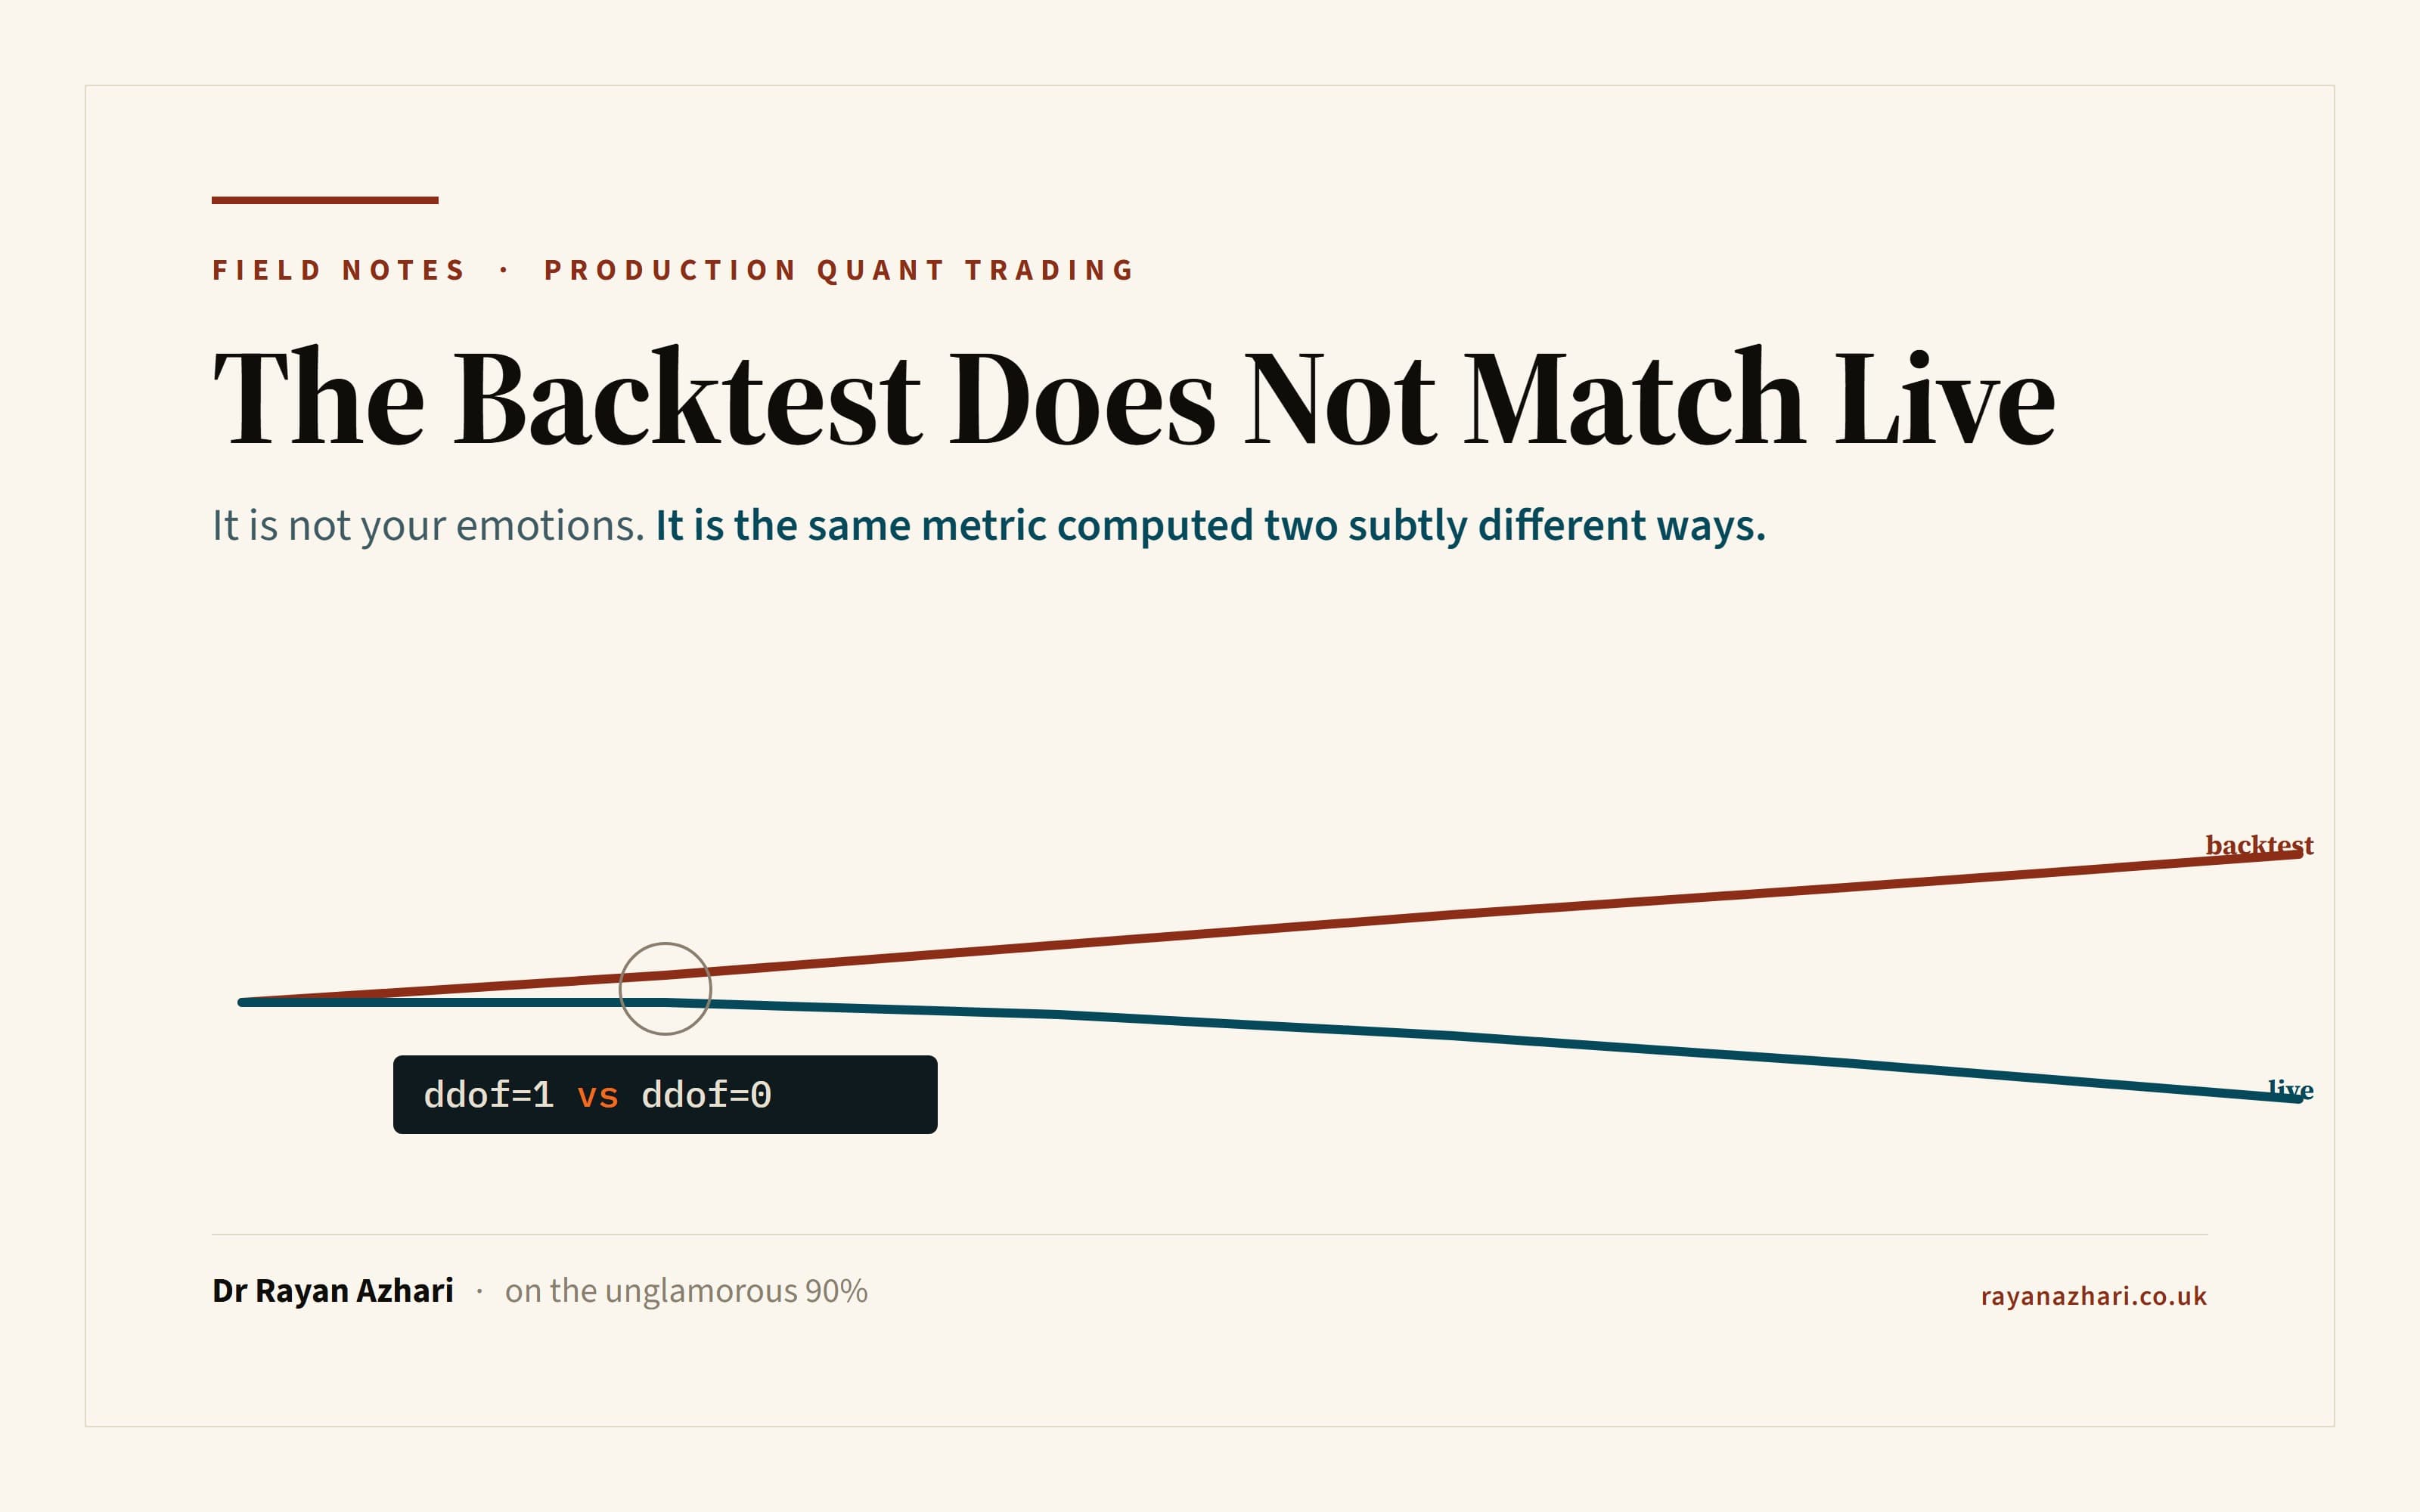
I lost the better part of a week to a divergence that turned out to be four characters long. Titan, my live multi-strategy system, had a sleeve whose paper-traded equity curve had started to peel away from the backtest I had signed off on. Nothing dramatic: a few basis points here, an entry a bar late there, a slow, patient drift that on any single day you could talk yourself out of seeing. By the end of a fortnight the two curves were unmistakably different animals that had left the same starting gate. I checked the data feed. I checked the fills. I checked the clock. The bug was none of those. The research metric computed its rolling standard deviation with ddof=1 (the sample estimator) and the live sizing path computed the same standard deviation with ddof=0 (the population one). The two differ by a factor of sqrt(n / (n - 1)), about a tenth of a percent on my window. That tenth of a percent, applied right at an entry threshold, moved the crossing onto a different bar just often enough to bend the whole curve.
If you have typed "live trading does not match backtest" into a search box, you have almost certainly been handed the platitude: live is different because your emotions get involved. For a discretionary trader, fine. For a systematic one, that answer is worse than useless, because the machine has no emotions. My live sleeve was a Python class listening to bars and emitting orders; it felt nothing. The divergence was not psychological. It was arithmetic. And the reason the incumbents reach for the emotional story is that the real causes are unglamorous, code-level, and invisible unless you go looking with the right tool.
Live and research are two programs, and nothing makes them equal
Here is the structural fact underneath every "my backtest was a lie" post-mortem. When you validate a strategy, you certify a research artefact: a function that maps a price history to a return series, run vectorised over a panel of data in a notebook. When you deploy it, you run a different program: a live class that consumes bars one at a time from a broker feed, carries a buffer, manages warm-up, and emits orders into an event loop. Same intent. Different code, different data shape, different control flow.
Nothing forces those two programs to compute the same thing. They almost always start identical, because you wrote the live class from the research one. Then they drift, and they drift for the most human of engineering reasons. The research code gets a vectorised speed-up. The live code gets a "small" approximation so it fits the event loop. Someone changes a lookback in one place and forgets the other. A library default differs between the two call sites. None of it shows up in a backtest, because the backtest never runs the live class. It shows up as a P&L curve that does not match the one you validated, and by the time the human eye can see the gap, the divergence has been spending real money for weeks.
Chart
The gap that accumulates, never breaks
A validated backtest and a live account leaving the same start and drifting apart, with no single sharp break. The cause is code-level: the same quantity computed two subtly different ways. Illustrative and sanitised.
That is the trap in one picture: two curves from one start, separating so gradually that no single day trips an alarm. The divergence is not a market regime. It is a bug, and the bug is a single quantity wearing two costumes.
The bug is one quantity wearing two costumes
Once you accept that live and research are two programs, the failure mode has a name: the same metric, computed two subtly different ways. It is never an exotic difference. It is a boring one, chosen by a library default or a stray convention, small enough that the direction of the signal agrees 99.9% of the time. But "almost always agrees" is not "always agrees", and the one place the two versions disagree is exactly the place that matters: right at a threshold, where a signal crosses on a different bar and the whole downstream chain forks.
Figure
The same metric, wearing four costumes
The three ways live quietly diverges from research, and the oracle that catches all of them.
ddof default
sample vs population
One path computes standard deviation with ddof=1, the other with ddof=0. They differ by a factor of sqrt(n/(n-1)), enough to drift a sizing decision.
Warm-up peek
window not yet full
One path emits a value before its rolling window has filled; the other waits. The first bars disagree, and the difference compounds.
Repaint
provisional vs settled
A value keeps revising after the bar closes. Research reads the settled number; live acts on the provisional one.
The parity oracle
feed both, assert equal
One synthetic input feeds both the research reference and the live path; an equality check in CI flags any mismatch, byte for byte.
Live and research must call the same code, not two copies that drift apart.
My ddof trap was the loudest costume, but the wardrobe is deep, and I have shipped most of it:
- The estimator default.
numpy.std()is population (ddof=0);pandas.rolling().std()is sample (ddof=1). Two call sites, two defaults, one silently wrong z-score. The same trap lurks in percentile conventions, inmedianversusmeantie-breaks, in how two libraries interpolate a quantile. - The warm-up window. This was the second half of my week-long hunt. The research metric, run over the whole panel, quietly had its full lookback available at every bar it reported. The live class, filling its buffer one bar at a time, was emitting a value before the window was truly full, computing the "same" statistic over a shorter, peeking sample for the first stretch after every restart. One path had its warm-up; the other peeked past it. Identical formula, different amount of history feeding it.
- The repaint. A value that keeps changing after the bar has closed. A smoother that revises yesterday's reading when today arrives, a signal that looks settled in the backtest (where the series is frozen) but wobbles live until later bars pin it down. Research sees the final, settled number. Live acts on the provisional one.
Notice the common thread. None of these is a difference in what the strategy does. Each is a difference in how one number is computed between two copies of the logic. And you cannot catch any of them by re-reading the code, because both versions look completely reasonable in isolation. The numpy line is correct. The pandas line is correct. They are only wrong relative to each other, and no amount of staring at one file surfaces a disagreement that only exists across two.
The portable artefact: a parity oracle in CI
Here is the diagnostic I want you to keep, the thing that ended my week-long hunt and now runs on every strategy before it can merge. Call it a parity oracle. The shape is always the same, and it is cheap enough to sit in the merge path.
Build a deterministic synthetic history: a seeded random walk, no data pipeline, no parquet, fast in CI. Feed that identical input to the research reference and to the live signal path. Then assert the two return the same number, bit-exact where the maths is genuinely identical, within a stated and justified tolerance only where the two implementations legitimately differ.
def test_live_matches_research_reference():
    closes = build_synthetic_universe(n=500, seed=42)  # deterministic, no I/O

    # ORACLE: the research function that produced the validated curve.
    reference = simulate_strategy(closes, ref_cfg).iloc[-1]

    # LIVE: the production class, event loop bypassed, buffer pre-loaded.
    live_targets = make_live_strategy(closes, live_cfg)._compute_targets_now()

    # Same input, same number, or it is a bug:
    assert live_targets.signal == reference["signal"]           # bit-exact
    assert live_targets.z_score == pytest.approx(               # the ddof trap
        reference["z_score"], rel=1e-12)                        # dies here
Two design choices make this honest, and they are the whole point.
The oracle must be independent. The single most seductive way to write a parity test is to call the live class twice and check it agrees with itself. That test passes forever and proves nothing, because a parity bug can only live in the live class, and a test that only ever consults the live class cannot see it. It measures determinism, not parity. The reference must be the research code that produced your validated track record, or a clean re-derivation that shares no machinery with the live path. When the two disagree, the disagreement is the finding. My ddof bug lived in the live sizer; only an oracle that ran the research estimator could have flagged it, and on its first run it did.
Pin every default. The reason the trap was invisible is that ddof was never written down in either file; each library just used its own default. So the oracle asserts the exact number and, better, the strategy pins ddof=1 explicitly at both call sites so the default can never differ again. The same rule covers the warm-up: the parity test does not compare only the last row, it replays the whole bar stream through both paths and asserts agreement at every bar, so a disagreement that only exists during warm-up cannot hide in the equilibrium. A single-snapshot test would have shown green while the peek was live.
Run this across a few random seeds, wire it into CI, and a strategy that drifts from research simply cannot reach the deploy branch. It costs milliseconds. It is brutally hard to fool, because it does not ask "does this code look right?" It asks the only question that matters: "do the two programs return the same number on the same input?"
The deeper rule: one code path, not two copies
The parity oracle catches drift. The rule behind it prevents drift, and it is the sentence I would tattoo on a new build: live and research must call the same code, not two copies of it.
The way I close the gap in Titan is that the live class does not re-implement the hard maths at all. It delegates the signal computation to the same research function the backtest called. Parity then holds by construction, and the oracle exists to prove that delegation never quietly gets replaced by a "faster" live approximation. The moment someone optimises the live path into its own copy of the estimator, they have re-created the two-programs problem, and the test goes red before it can touch capital. A metric that exists in exactly one place cannot disagree with itself. A metric that exists in two places will, eventually, on the one bar that matters.
That is the whole discipline compressed. A divergence between backtest and live is not a mystery of trader temperament. It is a diff between two functions you let drift apart, and you close it by refusing to let them be two functions in the first place.
The full machinery, the parity harness that walks the complete decision chain from signal to integer position, the boundary-grid tests that hammer the float-fragile thresholds, the strategy-class contract that makes single-source delegation enforceable, and the causality gate that proves the shared code is not merely equal but legitimate, lives in the paid half of my book, Building a Production Quant Trading System, a living digital copy on Leanpub and a print paperback on Amazon. A sanitised, Apache-2.0 skeleton of the parity oracle and the layout it sits in is on GitHub. If your live curve is quietly walking away from your backtest, do not reach for the emotional explanation. Feed the same input to both paths and watch which number blinks.
This is an engineering essay, not investment advice, and it contains no tradable strategy. All figures are illustrative and sanitised, and the war-stories are about bugs, not profits.
Chart
The gap that accumulates, never breaks
A validated backtest and a live account leaving the same start and drifting apart, with no single sharp break. The cause is code-level: the same quantity computed two subtly different ways. Illustrative and sanitised.
Figure
The same metric, wearing four costumes
The three ways live quietly diverges from research, and the oracle that catches all of them.
ddof default
sample vs population
One path computes standard deviation with ddof=1, the other with ddof=0. They differ by a factor of sqrt(n/(n-1)), enough to drift a sizing decision.
Warm-up peek
window not yet full
One path emits a value before its rolling window has filled; the other waits. The first bars disagree, and the difference compounds.
Repaint
provisional vs settled
A value keeps revising after the bar closes. Research reads the settled number; live acts on the provisional one.
The parity oracle
feed both, assert equal
One synthetic input feeds both the research reference and the live path; an equality check in CI flags any mismatch, byte for byte.
Live and research must call the same code, not two copies that drift apart.
Further reading
- Look-Ahead Bias in a Backtest: The Corrupt-the-Future Test That Catches It
The warm-up peek and repaint costumes are look-ahead in the live path; the corrupt-the-future test transfers straight over.
- Suspicion Over Celebration: Inside "Building a Production Quant Trading System"
The parity oracle and the strategy-class contract are in the book.
Related posts
Fail Closed Data Validation: Why a Trading Bot Should Refuse to Boot on Bad Data
A data-quality gate that crash-loops on corrupt, stale or all-NaN data is not broken, it is working: the alternative is fail open, trading on garbage with silent defaults. Here is the war-story from both sides, the honest flip where an over-eager gate locked me out of a market, and the one portable rule: on bad data, refuse to trade and alert loudly, never proceed with a default that looks like data.
Bar Timestamp Convention: The Open vs Close Stamp That Leaks a Full Bar of Look-Ahead
A bar carries one timestamp, but that stamp is ambiguous: is a bar labelled 09:00 the open of the coming interval or the close of the last one? Vendors disagree, and reading the wrong edge is a clean one-bar look-ahead that sails through review. Here is the war-story, why the leak is invisible, and the ingest rule I now enforce on every feed.
Adjusted vs Unadjusted Close: The Dividend Double-Count That Fakes a Backtest Edge
Total-return and price-return series look identical on a chart and differ by percent-per-year underneath. Mix them, or fold dividends in twice, and a long-horizon backtest drifts a few percent above the honest one every year and compounds into a phantom edge. Here is the reconstruction check I now run: rebuild total return from price plus the dividend stream yourself and diff it against the vendor's adjusted series.