Adjusted vs Unadjusted Close: The Dividend Double-Count That Fakes a Backtest Edge
Total-return and price-return series look identical on a chart and differ by percent-per-year underneath. Mix them, or fold dividends in twice, and a long-horizon backtest drifts a few percent above the honest one every year and compounds into a phantom edge. Here is the reconstruction check I now run: rebuild total return from price plus the dividend stream yourself and diff it against the vendor's adjusted series.
The most expensive bug I have shipped into a backtest did not crash, did not look wrong, and did not move the Sharpe ratio. A holding strategy on a dividend-paying instrument came back from validation with a net-of-cost return a few percent a year better than it had any right to be. Every line of code was correct. The equity curve climbed a little too smoothly, a little too high, and passed the deployment gate by exactly the margin the bug had manufactured. The dividend had been counted twice: once inside the price series, which was already the vendor's total-return feed with dividends folded in, and once again in a cost model that assumed a price-only instrument and quietly credited the yield back. Two honest-looking components, each correct in isolation, and between them a phantom edge worth close to the entire gross margin of the strategy.
This is the quietest data bug in systematic trading, and almost nobody writes about it. It hides because the two series it concerns, price-return and total-return, look almost identical on a chart. It hides because it is invisible to the one number everyone optimises. And it hides because the error is not a spike or a glitch: it is a small, steady, plausible drift that only reveals itself over a long horizon, where compounding turns a rounding error into a fortune that was never there.
Two series that look the same and are not
A price-return series is the traded price: the opens, highs, lows and closes you would see on a broker screen. When a stock pays a dividend, the price mechanically drops by roughly the dividend on the ex-date, because the company just handed cash out of the door. A price-only chart therefore understates what a holder actually earned, because it never records the cash that left.
A total-return series, which most vendors call the adjusted close, folds those reinvested dividends and split adjustments back into the price. Its returns represent what a holder truly earned: capital appreciation plus dividends, compounded. This is usually the series you want for measuring an edge, because total return is the honest return of owning the thing.
For a dividend-paying instrument the two diverge by roughly the dividend yield per year. Call it two or three percent annually for a broad equity index. On a single day that is nothing. Over a year it is a small drift. Over twenty years of compounding it is the difference between a strategy that looks like genius and one that looks like a savings account. The gap is real, it is large, and it is completely invisible on any chart, because both series are perfectly smooth. You cannot eyeball the difference between a total-return curve and a price-return curve. You have to reconcile them.
Chart
Three curves that only fan out over time
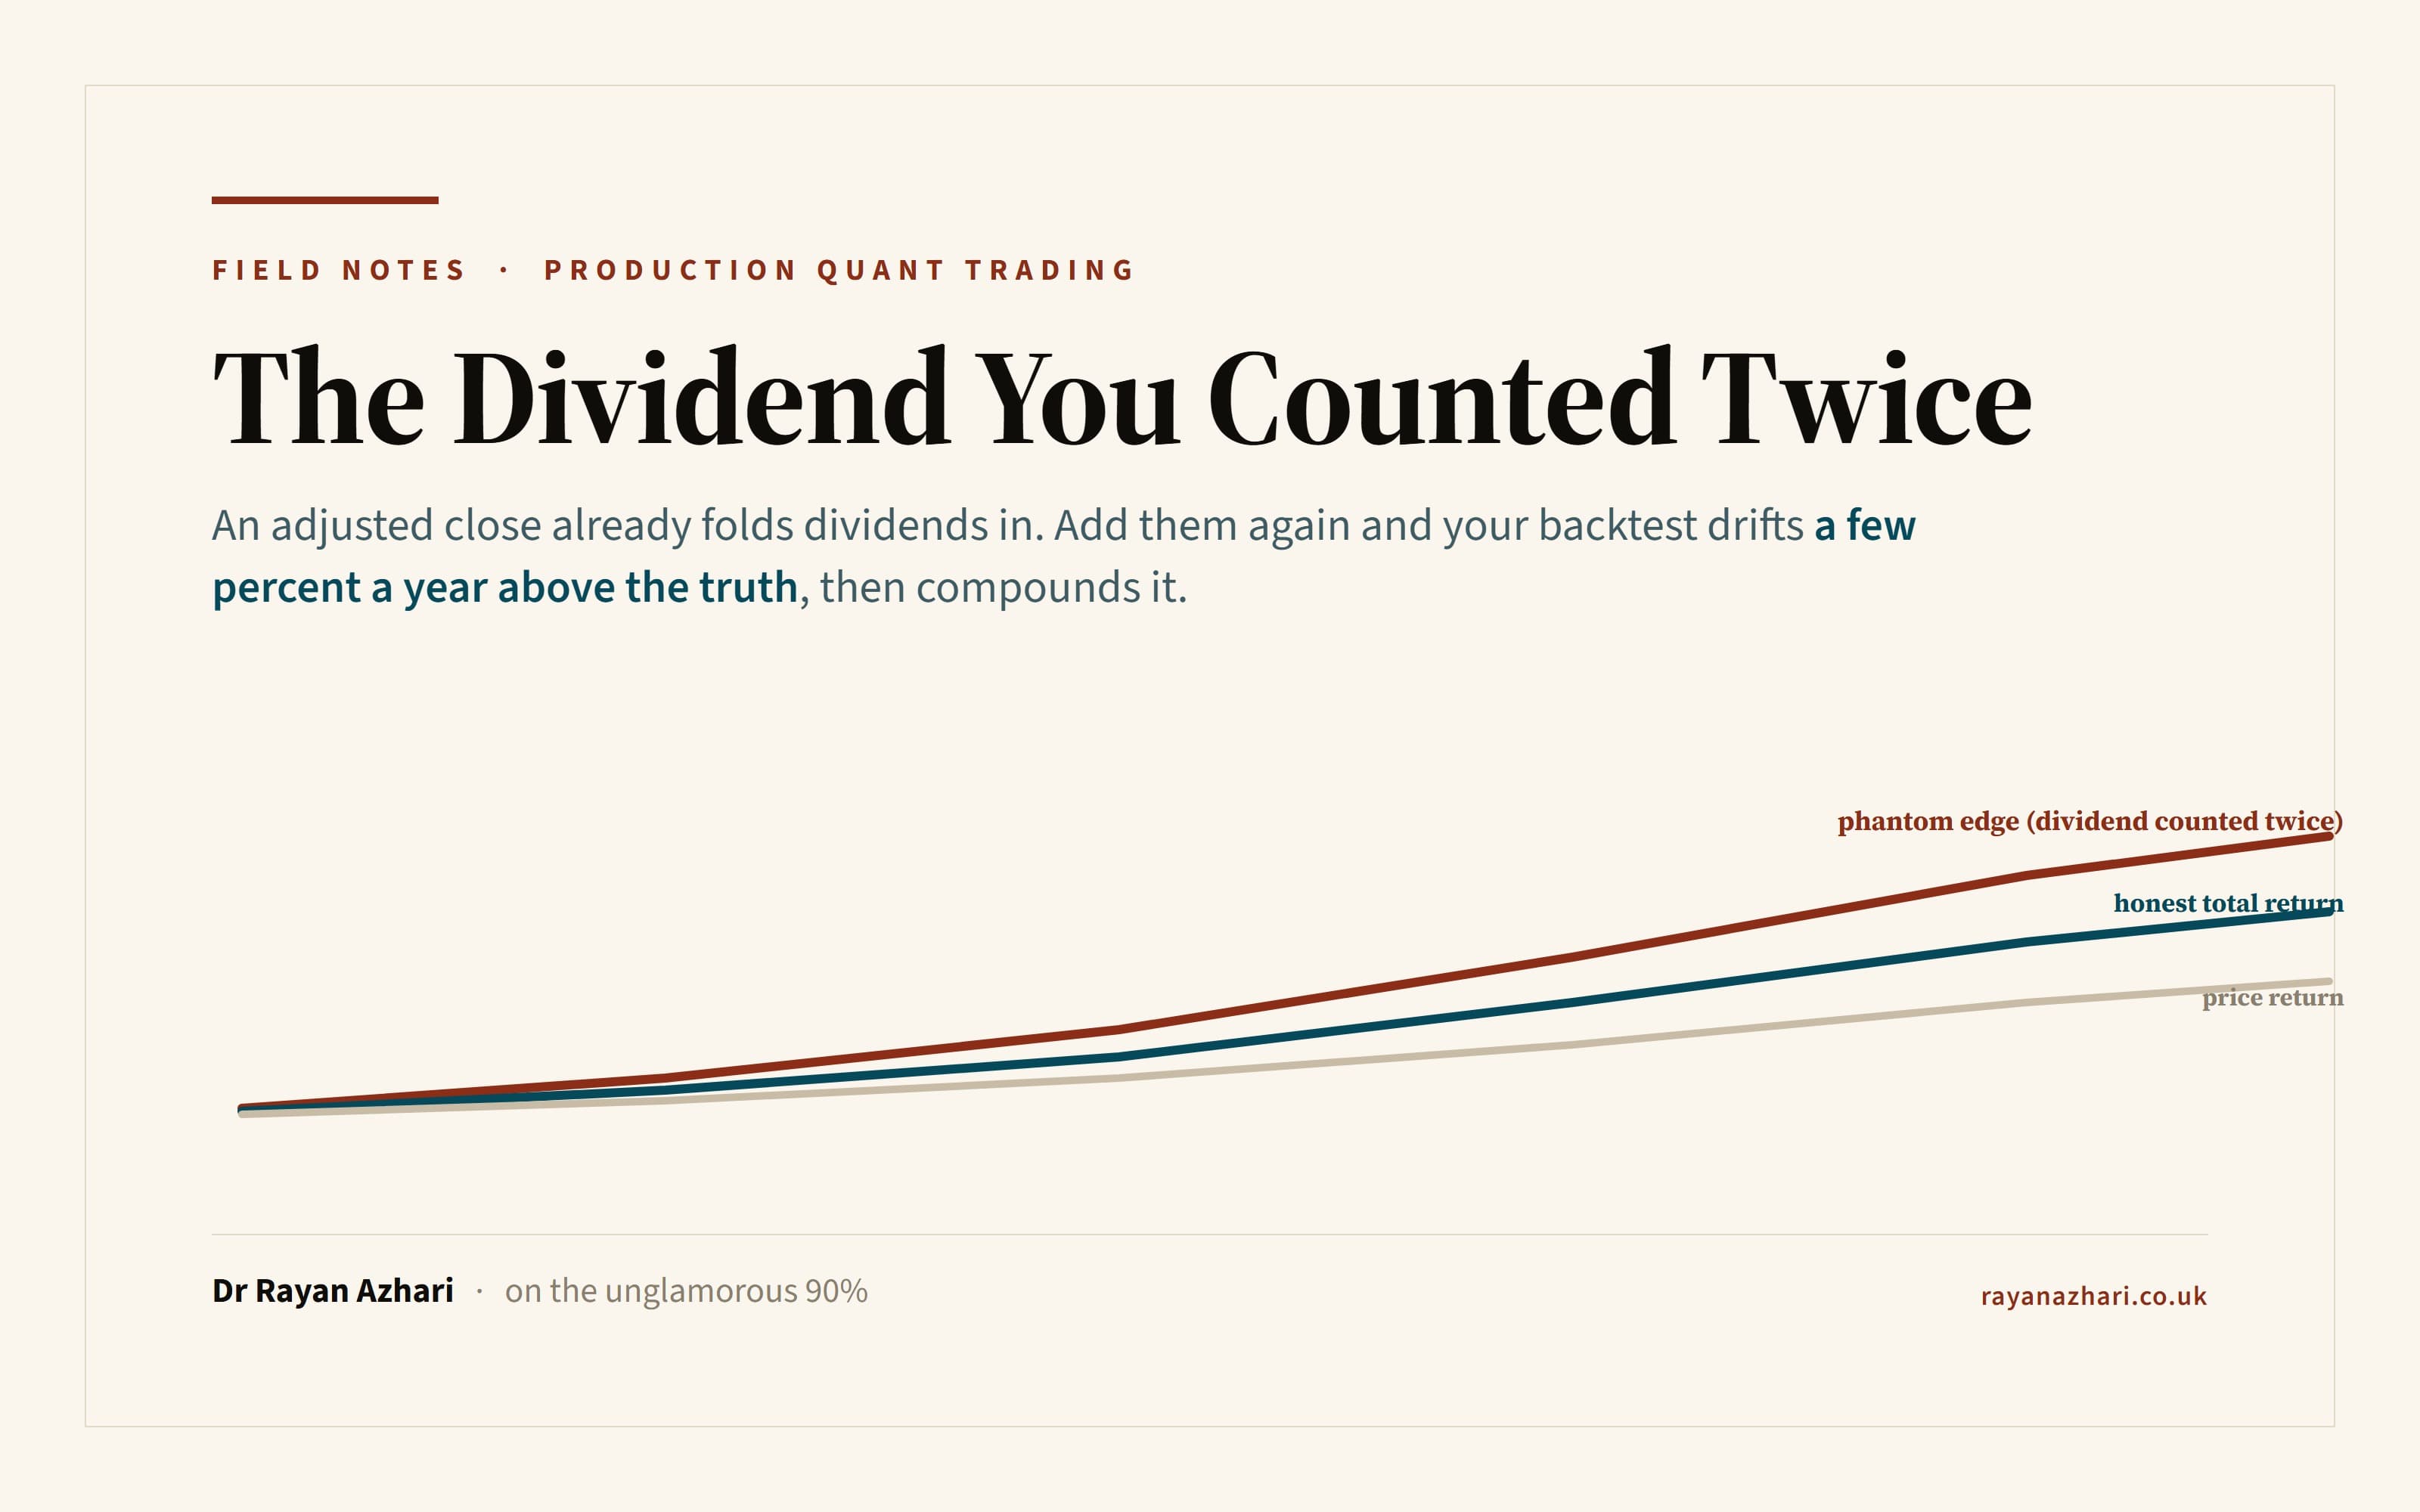
From the same start, a price-return series (dividends dropped), the correct total-return series, and a double-counted series that adds the dividend twice and drifts a few percent a year above the truth. Illustrative and sanitised.
Where the mistake actually enters
The bug is almost never "I used the wrong series." It is "I mixed regimes without knowing it," and there are three doors it walks through.
The double count in a cost model. You measure your edge on a total-return series, which already contains the dividend. Then your cost model, ported from an earlier study, charges a financing rate and implicitly assumes the dividend will offset part of it, calibrated against a price-only mental picture of the instrument. Now the dividend is in there twice: once inside the series, once as an offset in the cost model. Net-of-cost return inflates by close to the yield. This is the exact bug I shipped, and on a holding strategy with a modest gross edge it was the whole margin between pass and fail.
The benchmark mismatch. You run a total-return strategy and compare it against a price-only benchmark, or the reverse. Your strategy earns dividends; your benchmark does not record them. You will beat that benchmark by the dividend yield every single year while adding no skill whatsoever. The outperformance is pure accounting. The same trap swallows pairs and cross-asset signals: a total-return bond proxy ranked against a price-only equity proxy is measuring a dividend-yield spread, not a relationship, and the signal can look beautifully real while being nothing but a units error.
The mid-series regime flip. The same local filename gets refreshed from a source with a different adjustment convention. Now your series is total-return before some date and price-only after, with a discontinuity at the changeover that no chart will ever show you, because both halves are individually smooth. Every return computed across that seam is wrong, and nothing flags it.
Figure
Which series includes the dividend, and where the mistake enters
Invisible to Sharpe, which shifts the mean not the volatility. Very visible to CAGR and Calmar over a long horizon.
Price-return series
dividends not included
The traded close alone. Correct on its own, but it understates a buy-and-hold total return by the dividend yield, compounded.
Adjusted / total-return series
dividends already folded in
An adjusted close already reinvests the dividend. This is complete on its own; the danger is treating it as if it were not.
The double count
add them again
Take the adjusted series and then credit a separate dividend yield on top, or benchmark a total-return strategy against a price-only index. A steady phantom drift that compounds.
Reconcile your series against a known total-return index before you trust a long-horizon edge.
Why Sharpe cannot see it and Calmar can
Here is the property that makes this bug so durable, and it is worth internalising on its own. A total-return-versus-price confusion shifts the mean of your return series. It adds, or removes, a roughly constant drift of a few percent a year. It barely touches the volatility.
Now look at what Sharpe is: mean excess return divided by volatility. A constant drift moves the numerator a little and the denominator not at all, and on a strategy with any meaningful volatility that shift is a small fraction of the ratio. So the Sharpe of the double-counted backtest and the honest one are practically the same. The bug is below the resolution of the metric everyone reports. If your validation ends at Sharpe, this error will sail straight through it, every time.
But move to the metrics that live on the compounded path and the drift stops being invisible and starts being decisive. CAGR is geometric: it compounds that few-percent drift across the whole horizon, so a decade of phantom yield shows up as a materially higher annual growth rate. Calmar, return over maximum drawdown, inherits the same inflated numerator while the drawdown denominator barely moves, so it lifts in lockstep. Net-of-cost P&L, the number that actually decides deployment, carries the full doubled yield. The bug that is a rounding error to Sharpe is a headline error to CAGR and Calmar.
This is why the confusion is a rounding error for a fast intraday strategy and a catastrophe for a holding strategy. Carry, financing and borrow are all quoted as percent-per-year. A total-return-versus-price mismatch is also percent-per-year. They are the same order of magnitude. For a strategy that turns over in minutes, a few percent a year spread across thousands of round trips is noise. For a strategy that holds for months, whose entire edge might be a few percent a year, it is the edge. The slow, small-edge strategies you most want to get right are exactly the ones this bug flatters hardest.
The portable artefact: reconstruct total return yourself and diff it
If you take one thing from this piece, take this, because it is the check that would have caught my bug in an afternoon instead of a validation cycle.
Do not trust the vendor's adjusted series. Rebuild it from first principles and diff.
You almost always have, or can get, two raw ingredients: the unadjusted close (the actual traded price) and the dividend stream (ex-date and cash amount per share, plus split factors). From those two, you can reconstruct total return yourself. The idea is a definition, not a library call: on each dividend ex-date, the holder receives the cash and reinvests it, so the total-return index grows by the price return plus the dividend reinvested at that day's price. Compound that adjustment factor across the whole history and you have built a total-return series with your own hands, from inputs you can see.
Then diff your reconstruction against the vendor's adjusted close. Three outcomes, three verdicts:
- They match to within floating-point noise. The vendor's adjustment convention is exactly what you think it is. You now know the series is total-return, you know how the dividends were handled, and you have a provenance fact instead of an assumption.
- They diverge by a smooth, compounding drift of roughly the dividend yield. The vendor series is price-only and you thought it was total-return, or the reverse. You have caught the mixing before it reached a cost model.
- They match up to some date and then diverge. You have a mid-series regime flip: the file was refreshed from a source with a different convention. The date of the divergence is the exact seam.
The same reconstruction gives you the benchmark check for free. Before you compare a strategy to an index, reconcile your benchmark series against a known total-return version of that index. If they disagree by the yield, you are about to grade yourself against the wrong ruler.
The rule underneath all of it is one sentence, and it is the sentence I now pin to every holding-strategy validation: a return series and the cost model applied to it must agree on the adjustment convention, and that agreement must be written down, not assumed. Total-return series get a cost model with no separate dividend term. Price-only series carry the dividend explicitly. When a number is percent-per-year, an unrecorded percent-per-year assumption is an unbounded error, because you have no idea which way it leans or by how much.
What I do not give you here
The reconstruction diff is the diagnostic, and it is genuinely portable: you can build it this week. What I have deliberately kept out of this essay is the machinery that makes it stick in production. How I record adjust as a first-class, load-bearing provenance field on every series so a file with an unknown adjustment convention is refused for any cost-modelled strategy rather than silently defaulted. The exact schema of the provenance sidecar and the manifest gate that catches a mid-series convention flip the moment a refresh writes it. The full split-and-dividend reconstruction, including the corner cases that make a naive version disagree with the vendor for innocent reasons. The gross-to-net bridge, reconciled line by line, that turns "the numbers roughly agree" into a gate a strategy either clears or does not.
That is the paid half of the book, Part III on data, and it is not published online for the same reason the bug is dangerous: the value is in the exact discipline, not the general idea.
If these field notes are useful, the full treatment lives in Building a Production Quant Trading System, a living digital copy on Leanpub and a print paperback on Amazon, where the data chapter walks the provenance schema, the manifest regression gate, and the total-return reconstruction end to end with the code. A sanitised, Apache-2.0 skeleton of the data layer lives on GitHub. And if you want the next field note when it lands, the newsletter is where it goes first.
Carry one sentence out of here: an adjusted close is a claim about how dividends were handled, never a fact, and until you have rebuilt it yourself and diffed, you do not know which series you are trading.
This is an engineering essay, not investment advice, and it contains no tradable strategy. All figures are illustrative and sanitised, and the war-stories are about bugs, not profits.
Chart
Three curves that only fan out over time
From the same start, a price-return series (dividends dropped), the correct total-return series, and a double-counted series that adds the dividend twice and drifts a few percent a year above the truth. Illustrative and sanitised.
Figure
Which series includes the dividend, and where the mistake enters
Invisible to Sharpe, which shifts the mean not the volatility. Very visible to CAGR and Calmar over a long horizon.
Price-return series
dividends not included
The traded close alone. Correct on its own, but it understates a buy-and-hold total return by the dividend yield, compounded.
Adjusted / total-return series
dividends already folded in
An adjusted close already reinvests the dividend. This is complete on its own; the danger is treating it as if it were not.
The double count
add them again
Take the adjusted series and then credit a separate dividend yield on top, or benchmark a total-return strategy against a price-only index. A steady phantom drift that compounds.
Reconcile your series against a known total-return index before you trust a long-horizon edge.
Further reading
- Suspicion Over Celebration: Inside "Building a Production Quant Trading System"
The full adjustment methodology and the data-quality gate are in the book.
Related posts
Survivorship Bias in a Backtest: The Delisted-Fraction Smell Test
Survivorship bias is the term every quant knows and almost nobody makes actionable. Here is the one-number diagnostic I run before I trust any cross-sectional backtest: count the dead names as a share of your universe over a decade. If it is near zero, your data quietly deleted the losers and every result is biased upward.
Capacity and Crowding: Why a Real Edge Still Decays at Size
Even a genuine edge dies if you deploy it too large. This is the field note on alpha-side risk: how your own market impact (capacity) and everyone else trading the same signal (crowding) shrink the size at which the edge is still yours, and the crossover test that tells you where your ceiling sits before the market finds it for you.
Sharpe Ratio Limitations: Why I Promote on Calmar, Not Sharpe
A candidate in my Titan system posted a Sharpe near 1.4, cleared every statistical gate, and still traced a drawdown so deep and so long that I could never have held it through the trough. Here is why Sharpe is blind to the path and the tail, the survival-metric suite (Sortino, Calmar, CVaR, CDaR) that sees what it misses, and the one rule it bought me: promote on Calmar lift, not Sharpe lift. All figures are illustrative and sanitised.