Survivorship Bias in a Backtest: The Delisted-Fraction Smell Test
Survivorship bias is the term every quant knows and almost nobody makes actionable. Here is the one-number diagnostic I run before I trust any cross-sectional backtest: count the dead names as a share of your universe over a decade. If it is near zero, your data quietly deleted the losers and every result is biased upward.
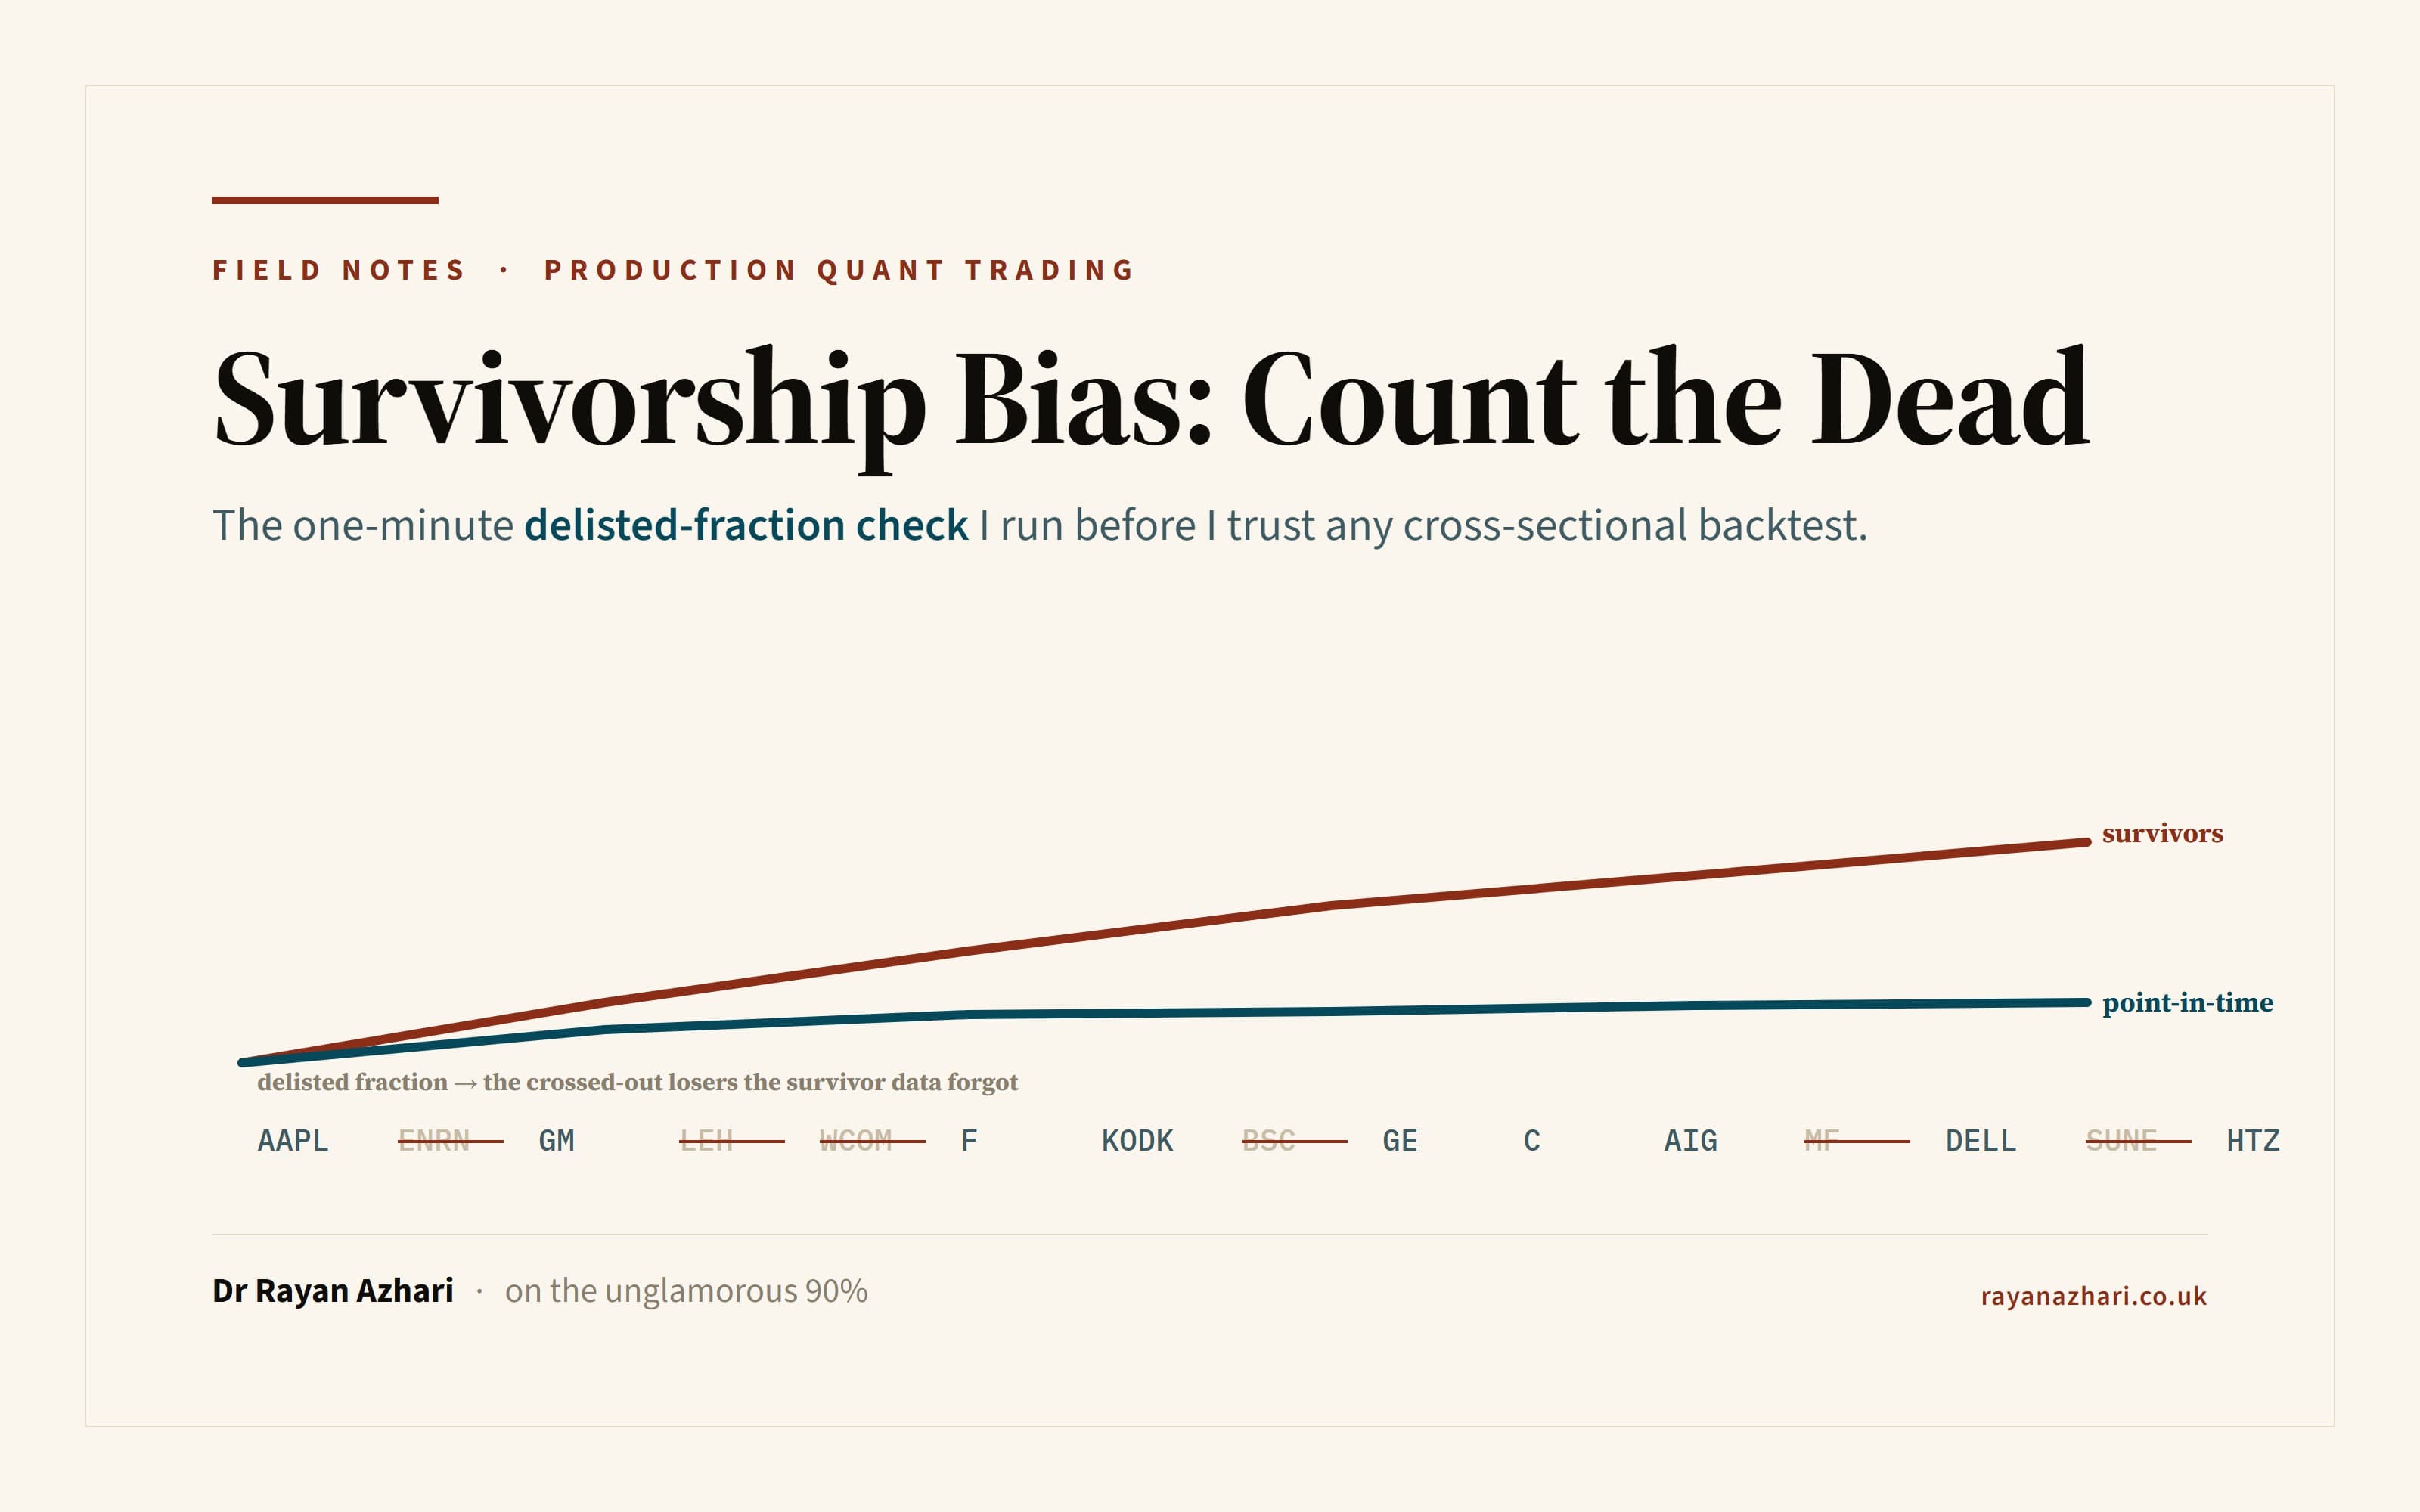
A cross-sectional rule I was testing looked wonderful on today's index constituents. It ranked names on a simple signal, held the top slice, rebalanced monthly, and produced a curve that climbed cleanly for a decade with drawdowns I could live with. I believed it. Then I rebuilt the universe point-in-time, putting back the companies that had delisted, merged or dropped out of the index along the way, the names the rule would actually have held at each date in the past. The edge faded to almost nothing. Same signal, same code, same window. The only thing that changed was that I stopped testing exclusively on the winners.
That is survivorship bias, and here is the uncomfortable part: everyone can define it, and almost nobody checks for it, because the standard definition ("you only tested on companies that survived") does not tell you how to look. It sounds like a philosophical caveat you nod at and move past. It is not. It is a measurable property of your data folder, and there is a single number that exposes it in about a minute. This piece is about that number.
Why the bias only ever flatters you
Survivorship bias belongs to the same family as every other way a backtest lies: it leans, systematically, in the optimistic direction. It is never a wash.
Think about what a cross-sectional strategy does. It ranks a universe and holds the best names by some signal, momentum, quality, value, whatever. Now think about which companies leave an index over a decade. Overwhelmingly, they leave because they did badly: they collapsed, got taken over at a discount, shrank out of the size band, went to zero. The survivors are, by definition, the ones that did not. So a universe built from today's constituents is a universe with the losers already deleted before your test begins.
That means your strategy is quietly rewarded twice. It gets credit for avoiding the failures, except it never had to avoid them, because they were removed from the menu. And it gets to rank only among names that were, in hindsight, good enough to still be here. The reported edge can be entirely an artefact of which names you were allowed to hold, not of the signal at all. You did not find alpha. You found the fact that the S&P 500 of 2026 is a list of companies that already won.
Chart
Same rule, two universes
The identical cross-sectional rule on today's survivors (climbs) versus a point-in-time universe that includes the delisted names (fades). Same code; only the universe differs. Illustrative and sanitised.
The chart above is the shape of the trap from my own work: the survivors-only curve climbs, the point-in-time curve carrying the delisted names fades. Nothing about the code differs between them. The bias lives entirely upstream, in the set of symbols the backtest was ever allowed to see.
The bias hides in the universe, not the prices
Here is the trap that catches careful people. You can have immaculate data, total-return adjusted, causally clean, point-in-time correct at the level of every individual series, and still run a badly survivorship-biased backtest. Because survivorship is not a property of any one price series. It is a property of the set of symbols you loaded.
If the company that delisted in 2015 is not in your data folder at all, then no amount of care with the files you do have will save you. Your 2014 backtest simply cannot hold a name that is no longer on disk. The data that would tell you about the failures is precisely the data that is not there, which is what makes this so hard to catch by inspection: you are looking for an absence. Clean prices on the wrong universe are still the wrong universe.
So the diagnostic question is brutally concrete. Can your backtest, at a date five years ago, hold a company that has since died? If the ticker is not even in your folder, the answer is no, and your cross-sectional edge is suspect before you have read a single line of the strategy.
The portable artefact: the delisted-fraction smell test
This is the one number I want you to keep. It needs no strategy, no framework, no clever infrastructure. It runs on the universe you already have, and it takes about a minute.
Count the dead names. Over your whole backtest window, take the set of every instrument that was ever a member of your universe. Now count how many of them are delisted, merged, or otherwise no longer trading at the end of the window. Divide.
delisted_fraction = dead_tickers / total_tickers_ever_in_universe
That fraction is your smell test. A genuine, point-in-time-complete, single-name index universe over a decade or more carries a large dead fraction. For a broad single-name index, it is typically a quarter to a third of all the names that were ever members. Churn is the natural state of an index over long windows; companies fail and get replaced constantly, and an honest universe remembers all of them.
So the reading is simple, and it is one-directional:
- A large dead fraction (roughly a quarter to a third over a long window) is the sign of health. Your data remembers the losers. Your backtest can hold a company that has since died.
- A suspiciously low dead fraction (say under 2%) is the smell of survivorship. Your data quietly dropped the losers somewhere upstream, and you are testing on survivors. Distrust the data before you distrust the strategy.
Chart
The delisted-fraction smell test
Dead names as a share of every name ever in the universe over a long window. Under 2% is the smell of survivorship; a healthy universe carries a quarter to a third. Illustrative and sanitised.
The bar chart is the whole diagnostic in one glance. Survivor data sits near 1 to 2% dead. An honest point-in-time universe sits near 25 to 33%. There is no smooth continuum where you have to squint; the two regimes are so far apart that the number is the answer. When a vendor hands me an equity panel and the delisted fraction comes back at 1.5%, I do not need to run a strategy to know what I am holding. I am holding a list of survivors with the failures deleted, and every cross-sectional result it produces will be biased upward.
Note the direction of the suspicion, because it is the useful part. Most bias hunts point at your code. This one points at your data feed. A low delisted fraction is not a bug in your strategy; it is evidence that the universe was constructed wrong, usually by a free vendor that only ever gives you the names alive today. The cheapest, most common cause of survivorship bias is simply not paying for the data that includes the dead.
The war story, and what the number would have saved me
The rule I opened with was, on paper, exactly the kind of result you want. It was not a knife-edge fluke; it was stable, it survived parameter nudging, and it climbed for years. Every instinct said this one is real. What I had not done, at first, was ask where my universe came from. It came from a convenient list of current constituents, because that was the data sitting on my disk, and current constituents are free and easy and everywhere.
When I finally rebuilt the universe point-in-time, restoring the names that had left the index over the decade and letting a delist be an event the backtest actually felt, the edge did most of its work through names that, in the survivors-only version, had simply never existed to compete. Put the failures back and the ranking changed at every rebalance. The curve faded. The signal had a small honest edge at best, and a large dishonest one that was pure accounting for who got deleted.
The lesson that stuck was not "point-in-time universes are important", which I already knew as a slogan. It was that I had a one-minute check that would have flagged the whole thing before I ever ran the strategy. Had I counted the dead fraction on that first convenient universe, it would have come back near zero, and I would have known the result was untrustworthy on the data alone. Now the delisted-fraction check runs before any cross-sectional backtest earns a minute of my attention. If the number is near zero, the universe is guilty until proven innocent, and the strategy does not get tested until the universe does.
That is the general shape of every survivorship story: the failure is invisible because it is an absence, and no amount of staring at the strategy code surfaces an absence. Only a check that asks "where are the dead?" surfaces it, and this check asks exactly that, in one division.
What the smell test does not do
Be clear about the limit, because a diagnostic you over-trust becomes its own trap. The delisted fraction tells you whether the failures are present. It does not, on its own, tell you they are correctly placed in time. A universe can carry all its dead names and still leak in subtler ways: membership applied on the announcement date rather than lagged to when you could actually have traded it, a delisted price forward-filled at its last value so a dead stock "holds" a position forever, a fundamental feature built from the final restated figure rather than the value that was public at the time. Those are real, and they are the reason building a genuine point-in-time universe is a chapter of work rather than a one-liner.
But the smell test earns its place precisely because it is cheap and it is decisive at the coarse end. It cannot certify a universe as perfect. It can, in a minute, tell you that a universe is definitely broken, which is the more common and more expensive case. Pass it and you have earned the right to worry about the subtler leaks. Fail it and none of the subtler questions matter yet, because you are testing on survivors and every result is fiction.
Where the machinery lives
The construction I keep out of this essay on purpose is the full point-in-time universe: the aligned total-return, dollar-volume and boolean membership matrices on a shared date index; the one-month membership lag; the rule that a delist ends a series with no forward-fill; the reconciliation that refuses any panel whose provenance does not record how it was built. That build, and the exact way a cross-sectional strategy consumes a per-date membership mask so a since-delisted name is still rankable in the year it was alive, is the paid part of the work. It is Part III of the book, and it is where survivorship stops being a caveat and becomes an interlock.
If you want that machinery, the delisted-inclusive universe, the manifest gate, the provenance schema and the runbook, it is in Building a Production Quant Trading System, a living digital copy on Leanpub and a print paperback on Amazon. The sanitised, Apache-2.0 companion framework on GitHub shows the layout it lives in. This essay gives you the one-minute check; the book gives you the universe that passes it honestly.
Carry one number out of here. Before you trust any cross-sectional backtest, count the dead. If the delisted fraction is near zero, you are not measuring an edge. You are measuring who survived.
This is an engineering essay, not investment advice, and it contains no tradable strategy. All figures are illustrative and sanitised, and the war-stories are about bugs and biases, not profits.
Chart
Same rule, two universes
The identical cross-sectional rule on today's survivors (climbs) versus a point-in-time universe that includes the delisted names (fades). Same code; only the universe differs. Illustrative and sanitised.
Chart
The delisted-fraction smell test
Dead names as a share of every name ever in the universe over a long window. Under 2% is the smell of survivorship; a healthy universe carries a quarter to a third. Illustrative and sanitised.
Further reading
- Suspicion Over Celebration: Inside "Building a Production Quant Trading System"
The full point-in-time universe construction and the data-quality gate are in the book.
Related posts
Capacity and Crowding: Why a Real Edge Still Decays at Size
Even a genuine edge dies if you deploy it too large. This is the field note on alpha-side risk: how your own market impact (capacity) and everyone else trading the same signal (crowding) shrink the size at which the edge is still yours, and the crossover test that tells you where your ceiling sits before the market finds it for you.
Sharpe Ratio Limitations: Why I Promote on Calmar, Not Sharpe
A candidate in my Titan system posted a Sharpe near 1.4, cleared every statistical gate, and still traced a drawdown so deep and so long that I could never have held it through the trough. Here is why Sharpe is blind to the path and the tail, the survival-metric suite (Sortino, Calmar, CVaR, CDaR) that sees what it misses, and the one rule it bought me: promote on Calmar lift, not Sharpe lift. All figures are illustrative and sanitised.
Risk of Ruin Monte Carlo: Resample the Cause, Not the Effect
Most risk-of-ruin Monte Carlo resamples a strategy's realised P&L, which quietly bakes in the good luck you are trying to stress and understates the tail. Here is the correction that made my honest drawdown distribution far fatter than my first one, plus the relative gate a long-only sleeve actually needs. First person, British English, illustrative numbers only.