The Deflated Sharpe Ratio: Why Your Grid-Search Winner Is Probably Noise
The expected best Sharpe of a parameter sweep climbs as the grid grows, even when every strategy in it is worthless. Here is the deflated Sharpe ratio explained as a practitioner sees it, with a small N to noise-ceiling lookup table you can apply to your own sweep tonight, and the one rule that killed my proudest grid-search winner: N is the pool, not the podium.
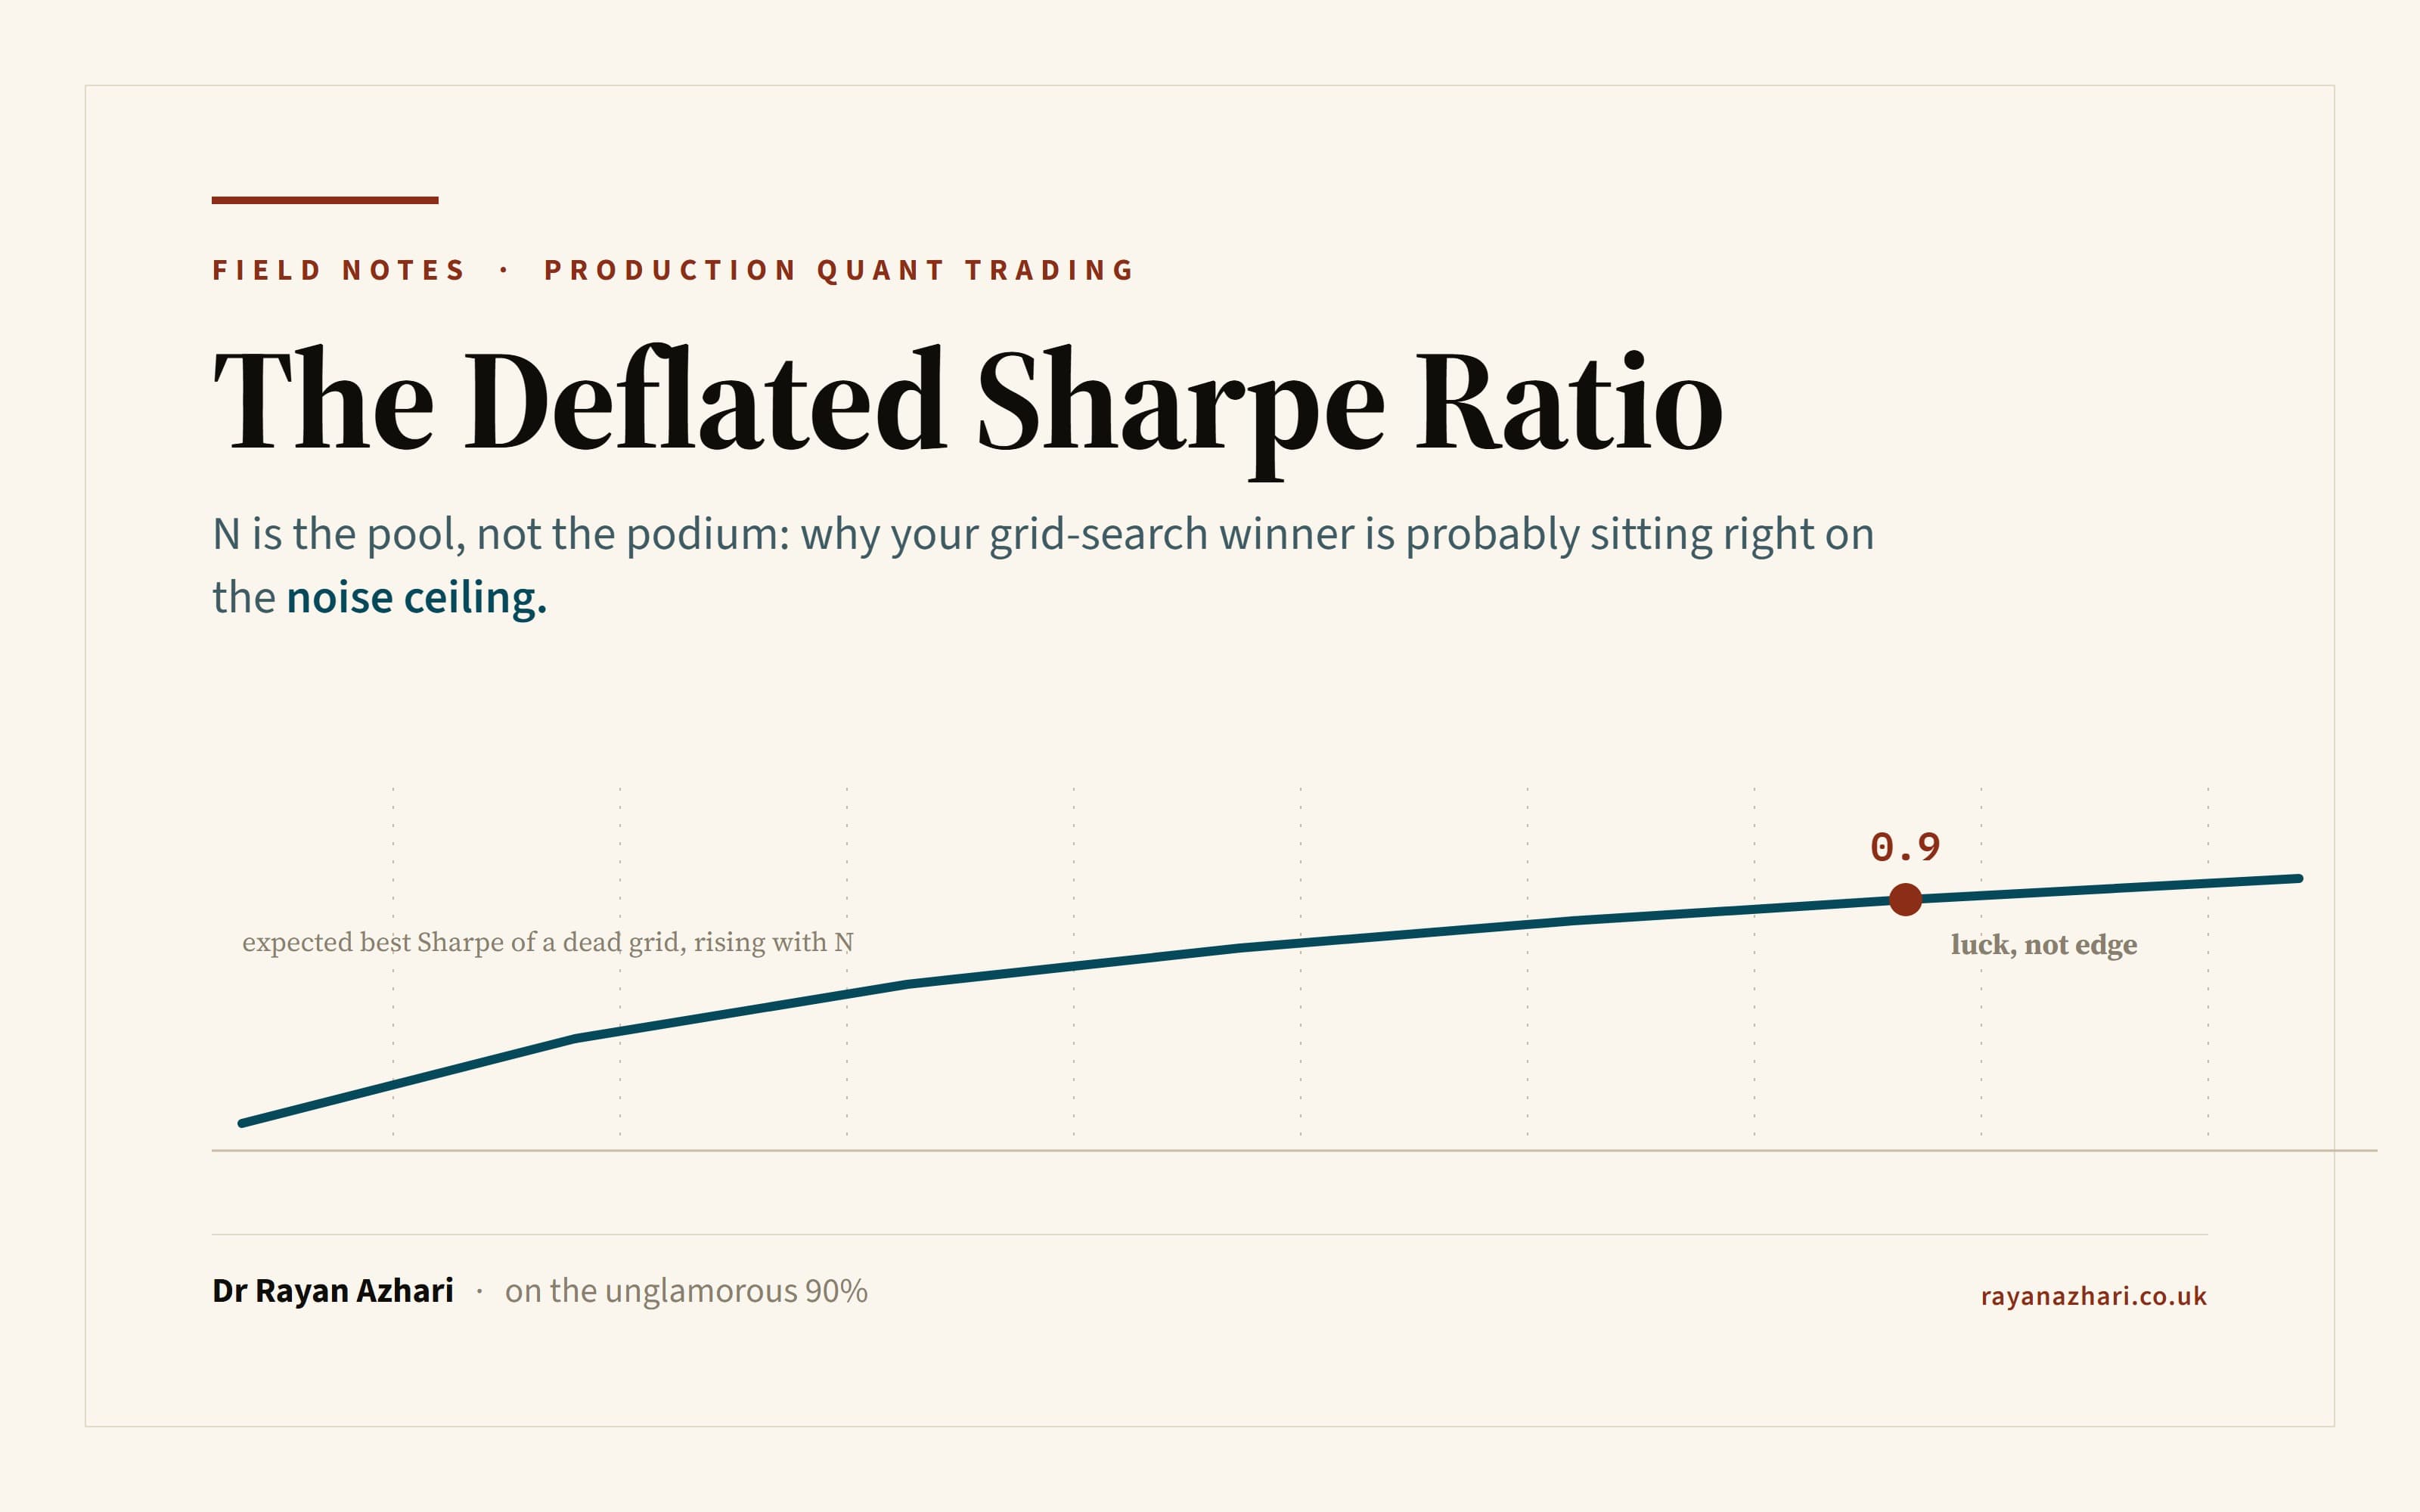
A grid search once handed me a winner with a Sharpe just under 0.9. It sat at the top of a couple of hundred parameter cells, its equity curve climbed the right way, and I had a config file named after it before I had finished my coffee. It felt like a result. It was not. When I finally did the arithmetic the search had been quietly running behind my back, the honest expected best of that dead grid, purely from luck, with no edge anywhere in it, came out at roughly 0.88. My proud winner was the noise ceiling with a thin coat of paint.
This is the failure mode the deflated Sharpe ratio exists to catch, and it is the single most citable, most under-applied idea in the whole business of testing strategies. So this piece is the practitioner's version: what the number means, one lookup table you can hold against your own sweep tonight, and the rule that turned my 0.9 from a discovery into a deletion. The one sentence to carry out is this: N is the pool, not the podium.
The maximum of many draws climbs on its own
Start with a grid where every single cell is genuinely worthless. True Sharpe zero, all of them. You still do not get a column of zeros back, because each cell is scored on a finite, noisy sample. Some land at minus 0.4, some at plus 0.5, and one, purely by sampling variance, lands highest. Report that one and you have manufactured a positive number out of a grid that contained nothing.
The uncomfortable part is that the size of that manufactured number is predictable, and it grows with how hard you searched. The maximum of N noisy draws drifts upward as N rises, and it does so even when the mean of every draw is exactly zero. The best cell in a sweep is, by the literal definition of "best", the one selected for being luckiest. So the headline Sharpe you are about to deploy is biased high by an amount that scales with the number of things you tried, and almost nobody subtracts it back off.
Chart
The noise ceiling: what luck alone produces
The expected best Sharpe of a completely dead grid (no edge anywhere) rises with the number of cells you try, N. A wider cross-trial spread lifts it further. Illustrative and sanitised.
That rising line is the thing to internalise. I call it the noise ceiling: the Sharpe you should expect from the winner of a completely dead grid of N cells. It depends on only two quantities. One is N, how many cells you tried, which everyone underestimates. The other is how spread out the cells' Sharpes are across the grid, the cross-trial dispersion, which everyone forgets to measure at all. Feed those two in and you get the height of the bar your winner has to clear before it has said anything.
The deflated Sharpe ratio, from Bailey and Lopez de Prado, is the formal machine that does this. It takes your observed Sharpe, subtracts the noise ceiling for your N and dispersion, folds in how fat-tailed your returns actually are (because skewed, heavy-tailed returns make the Sharpe estimator noisier than the point figure lets on), and returns a single probability: the chance the true Sharpe is above zero once the search is accounted for. I gate on 0.95. The full derivation, including why fat tails cost you, is in the free chapter; here I want to give you the artefact you can use without any of the algebra.
The lookup table you can use tonight
You do not need to run anyone's library to sanity-check a sweep. You need to know, roughly, where the noise ceiling sits for a grid of your size, and then look at your winner next to it. Here is that ceiling for a range of grid sizes, computed for an ordinary cross-trial Sharpe spread of about 0.25. The numbers are illustrative and sanitised, but the shape is exactly the closed form.
| Cells you tried (N) | Noise-ceiling Sharpe (dead grid, luck alone) |
|---|---|
| 10 | ≈ 0.39 |
| 25 | ≈ 0.50 |
| 50 | ≈ 0.57 |
| 100 | ≈ 0.63 |
| 250 | ≈ 0.71 |
| 1000 | ≈ 0.81 |
Chart
Noise ceiling by grid size
For a dead grid of N cells at an ordinary cross-trial spread of 0.25, the Sharpe you should expect from the winner by luck alone. Print it next to your winner. Illustrative and sanitised.
Read the N equals 100 row. Sweep a perfectly ordinary hundred-cell grid over a strategy with no edge whatsoever, and the expected best cell posts a Sharpe around 0.63. Not a tail event, not once in a hundred sweeps. That is the average outcome of an empty grid. If your hundred-cell sweep produced a winner at 0.65, you have found essentially nothing, and a bootstrap confidence interval on that one series will not save you, because it asks "is this particular curve significant?" and never knows the curve was the survivor of a beauty contest you ran across ninety-nine others.
Two things scale this table, and both are worth holding in your head. The ceiling grows with N, but slowly, roughly like the log, which is why the x-axis in the figure is logarithmic: going from ten cells to a thousand only lifts the ceiling from about 0.39 to 0.81. And the ceiling scales almost linearly with the cross-trial spread. Double the dispersion of Sharpes across your grid and you very nearly double the ceiling. My 0.9 war story had a wide spread, around 0.35, on a couple of hundred cells, and that combination is exactly what pushed the ceiling up near 0.9. Use 0.25 as your default mental multiplier and adjust up if your grid's Sharpes are all over the place.
The habit this buys you is one line in every sweep report: print the ceiling next to the winner. "Best cell 0.9, noise ceiling 0.88" tells the entire story at a glance. A reader who sees only the 0.9 thinks you have a strategy. A reader who sees both knows you have a coin flip with good production values.
N is the pool, not the podium
Now the part that decides whether the whole exercise is honest, and the part I got wrong for years. Every input to that table is mechanical except one, and the one is N. The judgement is entirely in the trial count, and it is almost always much larger than the number you instinctively want to write down.
Here is the trap in its purest form. I screen a universe of several hundred instruments, keep the handful that look good, and report N as the handful. Wrong. The selection pressure was applied across every name in the universe, not just the survivors. N is the whole pool. The survivors are the podium; the pool is everyone who ran. Report the podium and you have quietly shrunk the ceiling to a fraction of its true height, which is precisely the move that lets an overfit result pass a test it should fail.
The same sin has quieter costumes. The six-cell grid I "only just swept" was the sixth grid; the five earlier ones I abandoned still count, because my eyes evaluated them and threw them out for being worse. The stop I "tweaked by hand a few times until it looked right" is not one trial, it is every variant I looked at. And the biggest omission of all is feature search: screen thirty candidate predictors, keep the five that worked, and every one of the thirty belongs in N, usually multiplied by the cells you swept per feature. Feature selection is a parameter sweep wearing a lab coat, and it is the single most common way N gets undercounted by an order of magnitude.
The rule I now enforce, the one that killed the 0.9, is a single sentence: N is the size of the candidate pool the selection acted across, not the number of survivors you are proud of. The cleanest way to keep yourself honest is to write the grid and the trial count down before you run it, commit it, and let the audit read N from that committed manifest. A trial count is an input to a significance test, so inventing it after you have seen the winner is the same offence as p-hacking, dressed up as tidying.
Deflating against survivors flattered it; the full pool killed it
Back to my winner. When the 0.9 first failed my smell test, I did the lazy thing: I deflated it against the survivors only. I took the small cluster of cells that had made it through, measured their Sharpe spread, and used the survivor count as N. The result was almost passable. The survivors, by construction, had clustered high and tight, so their measured spread was small, maybe 0.15, and their count was a handful, so the ceiling I computed came out around 0.5. My 0.9 cleared it comfortably. I nearly shipped.
Then I did it properly, against the full pool the screener had actually searched. The real cross-trial spread across all the cells was wide, around 0.35, and the real N was the couple of hundred cells the selection had run over, not the survivors. The ceiling jumped to about 0.88. The gap between my winner and pure luck collapsed to a rounding error, the deflated probability fell through the floor, and the strategy was correctly declared what it always had been: the best of a dead grid. Two compounding mistakes had hidden it. The survivors' spread understates the true dispersion because survivors are exactly the cells that agreed with each other. The survivor count understates N because it drops everyone who lost. Both biases push the same way, toward optimism, which is the direction every backtest error leans in anyway.
Plateau, not spike
There is a cheaper, structural cousin of the deflated Sharpe that I run first, and it catches the same disease from a different angle. Take your winning cell and look at its immediate grid neighbours. A genuine edge is smooth: nudge the lookback from 19 to 20, or the threshold one notch, and the Sharpe barely moves. The winner sits on a plateau. A fitted artefact is a knife-edge: the winning cell posts 1.5 and its neighbours post 0.2. That is a spike, a single lucky draw surrounded by cliffs, and it is the textbook signature of having fitted noise rather than found signal.
The heuristic is worth pinning above the desk on its own: a sweep winner must be a plateau, not a peak. Two cells can post the identical headline Sharpe and deserve opposite verdicts. The one whose neighbours agree with it is robust; the one standing alone on a spire is an accident you are about to fund. The deflated Sharpe is the quantitative form of this concern, the maximum of N draws made into a probability. The plateau check is its structural form, and the two are complementary rather than redundant, because a broad plateau of correlated neighbours is exactly the case where the raw trial count most overstates the penalty. When they agree, you can move on. When they disagree, believe the pessimist.
The one number to keep
If you take a single move from all of this, take the habit of printing the noise ceiling beside every sweep winner, and computing it against the full pool you searched rather than the podium you kept. That one line turns a headline Sharpe from a claim you want to believe into a claim you can actually test, in under a minute, before any expensive validation runs. The strategies that die here, below the ceiling, deserve to, and they die cheaply.
The full method, the closed form for the ceiling, why fat tails earn a lower score, and how the deflated Sharpe becomes one binding axis in a wider deploy-or-bin decision, is the free chapter Beating your own optimiser, which is free to read and part of the free half of Building a Production Quant Trading System; the complete book, a living digital copy on Leanpub and a print paperback on Amazon, goes on through position sizing, portfolio construction and operating the system live. If these field notes are useful, the newsletter is where each new one lands first; it is the cleanest way to follow the series as it goes out.
Carry the sentence: a grid-search winner with no accounting for how many things you tried is not evidence, it is the winner of a lottery you forgot you were running. N is the pool, not the podium.
This is an engineering essay, not investment advice, and it contains no tradable strategy. All figures are illustrative and sanitised.
Chart
The noise ceiling: what luck alone produces
The expected best Sharpe of a completely dead grid (no edge anywhere) rises with the number of cells you try, N. A wider cross-trial spread lifts it further. Illustrative and sanitised.
Chart
Noise ceiling by grid size
For a dead grid of N cells at an ordinary cross-trial spread of 0.25, the Sharpe you should expect from the winner by luck alone. Print it next to your winner. Illustrative and sanitised.
Further reading
- Walk Forward Optimization Is Not Automatically Out of Sample
The other half of the overfitting problem: deflation counts how many things you tried; walk-forward is about whether the test window was ever really unseen.
- Your Backtest Is Not Evidence: Why Retail Quant Systems Die Before They Trade
The series manifesto: a point-estimate Sharpe is the flattering lottery winner the whole posture exists to distrust.
- Suspicion Over Celebration: Inside "Building a Production Quant Trading System"
The deflated Sharpe is one binding axis of the go/no-go decision; the book review lays out the full guide.
Related posts
Look-Ahead Bias in a Backtest: The Corrupt-the-Future Test That Catches It
Look-ahead bias is the default state of careless backtest code, not an exotic edge case, and it survives review because it reads as ordinary pandas. Here is the corrupt-the-future causality test I now gate on: poison every price after a date, then assert nothing computed before it moves. If the past shifts when you poison the future, the strategy is reading ahead.
One Arrow, Drawn Once: The Architecture That Keeps Research Out of Production
The most dangerous code in a trading repo is the throwaway research notebook. One structural rule, dependencies that flow in a single direction, keeps it out of production and turns invisible coupling into a number you can grep.
Survivorship Bias in a Backtest: The Delisted-Fraction Smell Test
Survivorship bias is the term every quant knows and almost nobody makes actionable. Here is the one-number diagnostic I run before I trust any cross-sectional backtest: count the dead names as a share of your universe over a decade. If it is near zero, your data quietly deleted the losers and every result is biased upward.