Capacity and Crowding: Why a Real Edge Still Decays at Size
Even a genuine edge dies if you deploy it too large. This is the field note on alpha-side risk: how your own market impact (capacity) and everyone else trading the same signal (crowding) shrink the size at which the edge is still yours, and the crossover test that tells you where your ceiling sits before the market finds it for you.
I once had a sleeve that passed everything. A slow cross-asset signal, positive lower bound on the bootstrap Sharpe, a clean plateau rather than a spike, no look-ahead, survivable drawdown. Every research gate I owned went green. It went to paper, and on paper it stayed lovely. Then someone asked the one question my whole validation stack had never been built to answer: what is the capacity? What is the biggest size we can actually run this at?
I re-ran the cost gate with the impact term evaluated at the participation a real allocation would imply, a meaningful slice of a not-especially-liquid instrument's daily volume, and watched the net lower bound slide toward zero at roughly a tenth of the book size somebody had in mind. The edge was real. It was just small, and pooled in shallow water. Deployable on paper, at toy size, and an outright loss at the size we wanted. I had built a strategy that only worked at the size where it did not matter.
The one risk you only earn by being right
Every earlier field note in this series is about avoiding fake edges: the backtest that lies upward, the look-ahead leak, the search that manufactures a phantom Sharpe. Capacity is the opposite kind of problem, and it is stranger for it. It is the risk you only face once your edge is genuine. A fake edge has no capacity question, because it has nothing to fill up. A real one does, and the real one will still decay, because two separate forces are quietly working to shrink the size at which the edge belongs to you.
The first is capacity: your own footprint. When you buy, you move the price against yourself, and that self-inflicted cost grows with how much of the market you try to eat at once. The second is crowding: other people finding the same trade, competing the mispricing away, and (worse) standing on the same side of the boat when it tips. One force you cause, the other you suffer. Both do the identical thing to you, which is to put a ceiling on size that no formula in your sizing chain knows exists.
The sizing chain has no ceiling in it
Here is the gap that let my shallow sleeve get as far as paper. Walk the sizing chain a production system runs: a Kelly fraction hands back a leverage, vol-targeting converts it to a notional, the allocator weights it against everything else in the book. Now ask each of those steps what the average daily volume of the traded instrument is. None of them knows. None of them asks. The maths will cheerfully hand you a clip the market cannot absorb in a day, and it will do so with no error, no warning, no red flag. It is arithmetic, and arithmetic does not care about liquidity.
That is the quiet trap. Everyone's sizing chain computes how much conviction says to hold. Almost nobody's computes how much the market will let you hold without your own trading eating the edge. The first number is bounded only by your risk appetite. The second is bounded by physics, and it is almost always the smaller of the two.
The square-root wall
Why does size hurt at all? Because market impact is not free and it is not linear. Slippage grows with your participation, which is your order size as a fraction of the instrument's daily volume, and it grows roughly with the square root of that participation. That shape is the entire story of capacity, so it is worth feeling rather than just reading.
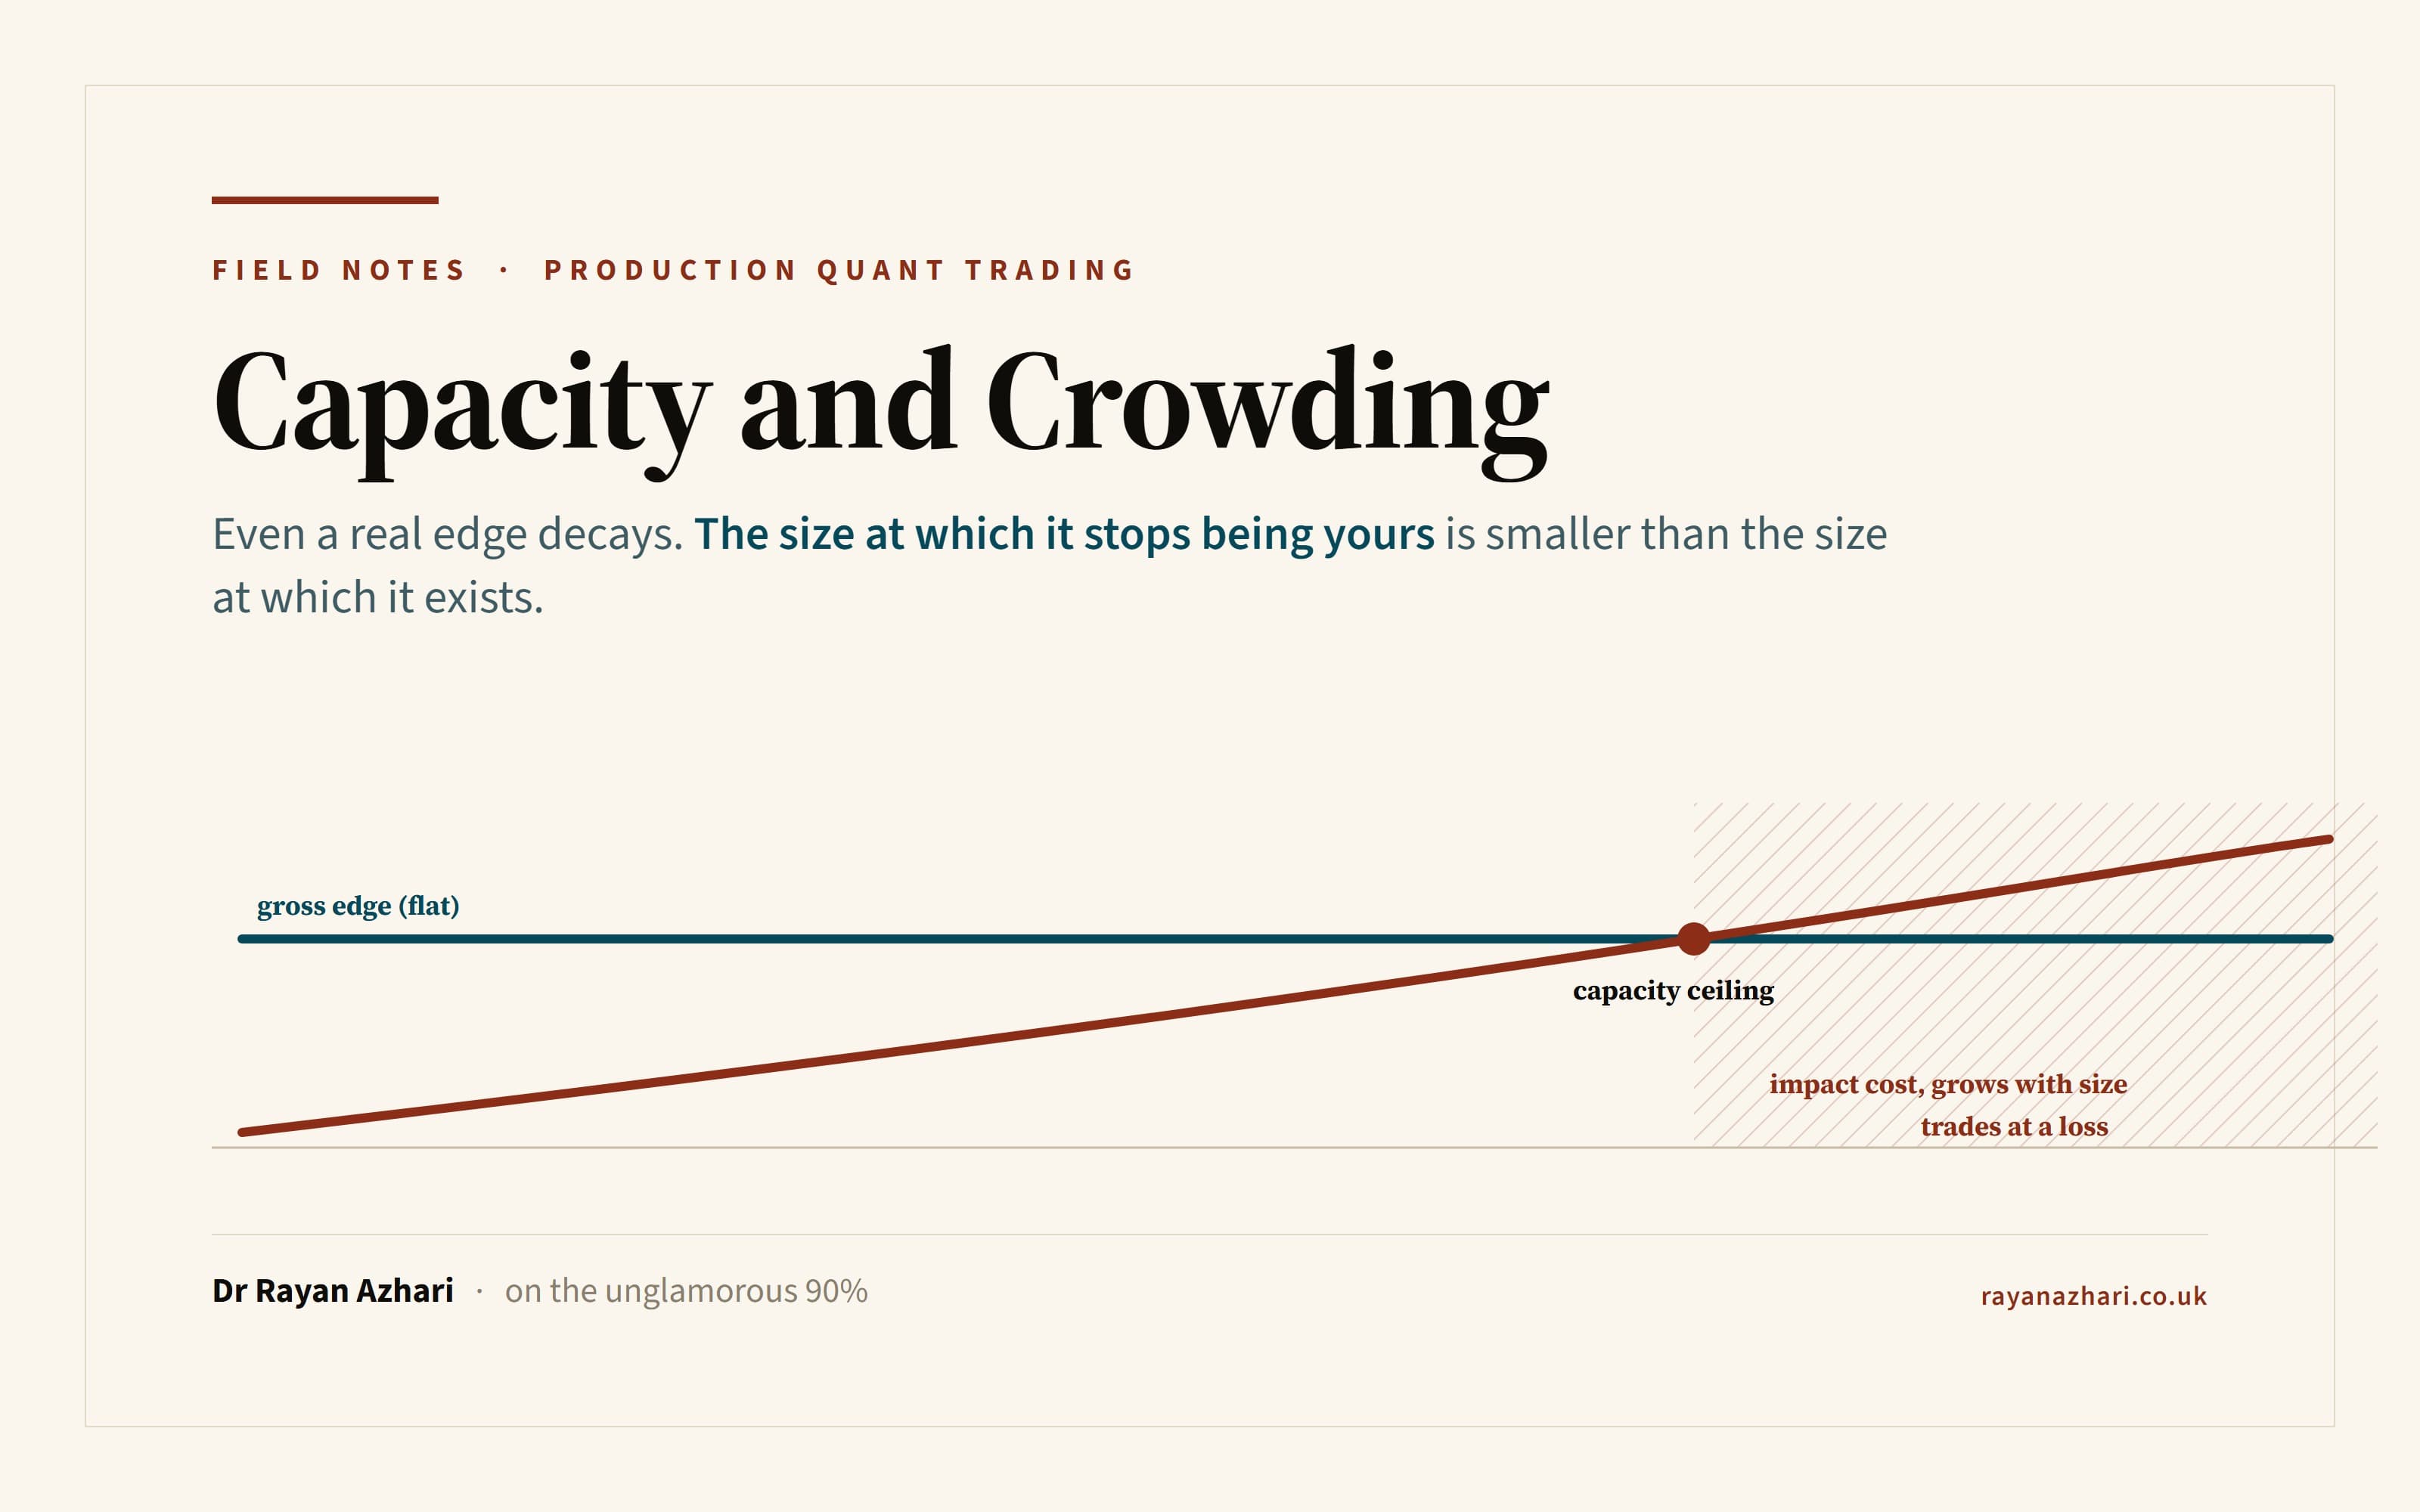
At toy size, participation is a rounding error. You are a minnow in an ocean, impact is invisible, and this is precisely why a backtest run at near-zero notional reports an edge that looks free. It is free, at that size. As you scale up, participation climbs, and per-unit impact climbs with its square root, and because you pay that cost on every unit you trade, the total impact you eat scales faster than the size you are trying to deploy. Somewhere on that rising curve, the impact cost you pay equals the gross edge you measured. That point is your capacity ceiling. Every pound of size beyond it trades at a loss.
Chart
The capacity ceiling
Gross edge per unit is roughly flat with size; marginal market-impact cost rises with the square root of participation. Where they cross is your ceiling; beyond it, every unit trades at a loss. Illustrative and sanitised.
That is the portable artefact from this piece, and it is deliberately a picture, not a formula. Draw two lines against book size. The first is your gross edge, and at the scale that matters it is roughly flat: the alpha per unit does not care how big you are. The second is your marginal impact cost, the square-root curve, starting near zero and bending upward. They cross. Left of the crossover, the edge clears the cost and you keep the difference. Right of it, the shaded region, impact has swallowed the alpha and you are paying the market for the privilege of trading against yourself. The crossover is your ceiling. Size below it. That is the whole rule.
There is a nasty corollary hiding in the "you pay it every time you trade" part. Impact is a per-trade cost, so capacity is not a property of assets under management, it is a property of turnover. Two sleeves with the same edge and the same daily volume have wildly different ceilings if one turns over weekly and the other yearly, because the fast one pays the impact toll fifty-two times for every once the slow one pays it. A fast signal is a small-capacity signal, structurally, no matter how good it looks. This is the sober flipside of a lesson I keep relearning: every basis point of turnover you do not spend is capacity you buy back.
Deploy or not is a property of the strategy at a size
The reason my shallow sleeve slipped through is that I had been asking the wrong shape of question. I had been asking "is this strategy deployable?" as though deployable were a property of the strategy. It is not. Deploy or no-deploy is a property of the strategy at a size.
The fix is almost embarrassingly mechanical, which is why I like it. I already had a realistic-cost gate that re-runs the bootstrap Sharpe confidence interval on the net-of-cost return series and demands the lower bound stay above zero. The only change capacity asks for is to stop feeding that gate a fixed cost in basis points and start feeding it the impact implied by the participation your deployed clip actually creates. Then you do not run the gate once. You run it at a ladder of sizes: the minimum that clears commission, the size you actually want, twice that. And you watch the verdict flip from "deployable" to "over capacity" somewhere on the ladder.
When I did that, the sleeve that was a clean pass at the small clip was an outright reject at the intended one. Same edge, same code, same data. The impact term that was a rounding error at the bottom of the ladder was the entire edge at the top. The honest response to "it fails at the size I want" is not to argue with the slippage model or wish the impact away. It is to deploy it smaller, at or below the ceiling, and accept that a small, shallow-pooled edge is a small allocation. An edge run past its capacity is not a smaller edge. It is a negative one wearing the backtest's optimism.
Crowding: the ceiling you do not control
Everything above is the ceiling you impose on yourself, and it has the great virtue of being measurable: you can see your own size and you can estimate the market's depth. Crowding is the ceiling other people impose, and it is both more dangerous and nearly invisible, because you cannot see anyone else's positions.
Figure
Two forces, one ceiling
Capacity is the ceiling you impose on yourself; crowding is the one others impose.
Capacity
self-impact, measurable
Your own trading moves the price against you, growing with the square root of participation. You can see your size and estimate the market's depth, so you can draw this ceiling.
Crowding
others, nearly invisible
Others trade the same edge, compressing the alpha and standing on the same side when the boat tips. You cannot see their positions; the tell is a live edge drifting below its research baseline.
The size at which an edge is yours is smaller than the size at which it exists.
It does its damage in two distinct ways. The first is alpha decay. When capital piles into a signal, especially one lifted from a paper, a forum or a popular indicator, the money chasing the forecast compresses the very mispricing the forecast exploits. A real edge has a half-life, and a crowd shortens it. You cannot watch the crowd, but you can watch the symptom: a live edge quietly underperforming its research baseline, drifting down against the version of itself you validated. That live-versus-research drift is your crowding tell.
The second harm is the one that actually ends accounts, and it lives in the tail. A crowded trade is one where everybody holds the same position and everybody's risk model says "reduce" at the same moment. So the unwind is a stampede, the de-grossing is the crash, and your carefully diversified book turns out to be correlated with everyone else's precisely when you needed the diversification to save you. Crowding fattens the tail and synchronises the exit. It is the reason a book that looked beautifully spread in calm markets can move as one ugly lump in a sell-off.
There is no clean gate for this, only a posture. Assume any edge you found from a public source is more crowded than your backtest reflects. Treat its capacity estimate as optimistic before you even start. And lean on a genuine diversity of low-correlation edges rather than scaling a single crowded one, because the crowd's clock is not yours to set.
The takeaway you keep
Capacity and crowding are the same lesson told from two sides: the size at which an edge is yours is smaller than the size at which it exists. Your own impact caps it from below, on a square-root curve you can draw. The crowd caps it from a direction you cannot see, on a clock you do not control. Both are missing from every sizing formula that only knows conviction.
So carry the picture, not a number. Plot your flat gross edge against your rising square-root impact cost, find where they cross, and size below it. Then remember the second curve you cannot draw, the crowd's, and stay humble about any edge the world already knows. The most under-discussed number in retail quant is the largest size you can run before you start trading against yourself. Find it before the market finds it for you.
If you want the full method, the size-conditional cost gate, the turnover-as-capacity-lever argument, and an honest tally of which of these controls I have actually shipped versus merely specified, the chapter Capacity, crowding and the size at which the edge stops being yours is free to read. That chapter is part of Building a Production Quant Trading System; the complete book, a living digital copy on Leanpub and a print paperback on Amazon, is where sizing, portfolio construction and live operation are worked out end to end. If these field notes are useful, the newsletter carries each new one as it lands.
This is an engineering essay, not investment advice, and it contains no tradable strategy. All figures are illustrative and sanitised; the war-story is about a bug and a near-miss, never a profit.
Chart
The capacity ceiling
Gross edge per unit is roughly flat with size; marginal market-impact cost rises with the square root of participation. Where they cross is your ceiling; beyond it, every unit trades at a loss. Illustrative and sanitised.
Figure
Two forces, one ceiling
Capacity is the ceiling you impose on yourself; crowding is the one others impose.
Capacity
self-impact, measurable
Your own trading moves the price against you, growing with the square root of participation. You can see your size and estimate the market's depth, so you can draw this ceiling.
Crowding
others, nearly invisible
Others trade the same edge, compressing the alpha and standing on the same side when the boat tips. You cannot see their positions; the tell is a live edge drifting below its research baseline.
The size at which an edge is yours is smaller than the size at which it exists.
Further reading
- Your Backtest Is Not Evidence: Why Retail Quant Systems Die Before They Trade
The manifesto is about avoiding fake edges; capacity is the opposite, the decay that only a genuine edge earns, so it completes the picture.
- Suspicion Over Celebration: Inside "Building a Production Quant Trading System"
Capacity and crowding is one chapter of the free half; the book review lays out the full guide.
Related posts
Sharpe Ratio Limitations: Why I Promote on Calmar, Not Sharpe
A candidate in my Titan system posted a Sharpe near 1.4, cleared every statistical gate, and still traced a drawdown so deep and so long that I could never have held it through the trough. Here is why Sharpe is blind to the path and the tail, the survival-metric suite (Sortino, Calmar, CVaR, CDaR) that sees what it misses, and the one rule it bought me: promote on Calmar lift, not Sharpe lift. All figures are illustrative and sanitised.
Risk of Ruin Monte Carlo: Resample the Cause, Not the Effect
Most risk-of-ruin Monte Carlo resamples a strategy's realised P&L, which quietly bakes in the good luck you are trying to stress and understates the tail. Here is the correction that made my honest drawdown distribution far fatter than my first one, plus the relative gate a long-only sleeve actually needs. First person, British English, illustrative numbers only.
Walk Forward Optimization Is Not Automatically Out of Sample
Everyone sells walk-forward validation as proof a strategy is out-of-sample. It is not. I ran my own walk-forward pipeline on pure random-walk noise and it still produced a healthy positive stitched Sharpe, because out-of-sample is a property of provenance, not partitioning. Here is the random-walk control that tells you whether your pipeline, or your edge, produced the number.