Twenty-Three Point Six Billion Dollars, Before the Report
Global Financial Integrity's estimate of Syria's illicit financial outflows over 2000 to 2009 circulates as US$23.6 billion, often with a loss per Syrian attached. The report it is credited to gives two figures rather than one, divides by nobody, and was not yet published on the day the number first appeared.
A standalone article drawing on my forthcoming book Financing Syria's Reconstruction. Part 3 of 13 in the series What the Record Shows. Every figure carries its publisher, unit and date; every calculation that is mine says so.
Global Financial Integrity is a serious organisation, and its estimate of illicit outflows from Syria over 2000 to 2009 circulates as US$23.6 billion, often with a figure per head derived from it. I have not catalogued every place the number appears, and I do not need to. This is a case where the point at which a figure entered circulation can be dated exactly, and neither of the documents it entered through was the report.
In the last part of this series a number changed its meaning as it passed through four documents. This one changed its shape in the first two, and neither of them was the study it is credited to.
Two figures in one table
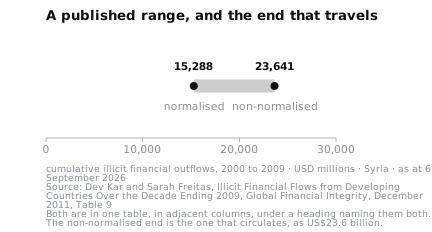
I obtained the report. Illicit Financial Flows from Developing Countries Over the Decade Ending 2009, by Dev Kar and Sarah Freitas, was published by Global Financial Integrity in December 2011. Its Table 9 gives Syria two figures, not one: a cumulative normalised, or conservative, estimate of US$15,288 million, and a cumulative non-normalised, or high-end, estimate of US$23,641 million. They sit in adjacent columns, under a heading that names them both. The larger is about 55 per cent above the smaller, on my arithmetic.
So the circulating figure is one end of a published range, printed without the other. That is the first failure, and it does not run in the direction it seems to.
The end the report prefers
It would be natural to assume that the conservative figure is the sound one and the high-end figure its inflated twin. The report says otherwise. Normalisation, it explains, is two filters. The first drops a country to zero where the model shows illicit inflows rather than outflows in a majority of the period 2000 to 2008, a nine-year test applied to a ten-year series. Whatever survives must then be at least 10 per cent of that country's exports, valued free on board, in that year.
Unfiltered estimates, in the report's own words, "provide the robust end of the range of possible values". Normalisation "may further compound the downward bias in estimates that is inherent in the use of stylized models", and the conservative range is included "for purposes of comparison although the truth may lie much closer to the upper (non-normalized) end of the range".
So quoting US$23.6 billion is closer to the publisher's own view than quoting US$15.3 billion would be. The charge that survives is narrower: printing either end of a published range without the other, whichever end you choose.
And the smaller number is not the larger one scaled down. Table 14, headed "Countries Dropped to Zero Due to Normalization", marks Syria in both of its columns, one for each of the report's two components, and the year-by-year tables show what that means. After normalisation Syria's balance-of-payments component is zero in all ten years. Its trade-mispricing component survives in three, 2002, 2003 and 2004, and those three sum to US$15,288 million exactly. Of that, US$12,761 million is a single year, 2004. The conservative figure is three years of one component.
What the figure is made of
The second failure is about what the estimate measures. The figure is routinely described as money stolen from Syria. The report builds it from two models. The first, applied to changes in external debt, captures in the report's words "the proceeds of bribery, theft, kickbacks, and tax evasion": four things at once, never separated. The second measures trade mispricing, which is not theft at all.
The report also keeps its two halves apart. Table 6 puts Syria's balance-of-payments component at US$6,313 million and Table 7 puts its trade mispricing at US$17,328 million. Together they make the US$23,641 million of Table 8 exactly, on the same unfiltered basis as the headline. Nearly three-quarters of the figure, on my arithmetic, is mispricing. Calling the total theft is not inventing a quantity. It is naming a mixed total after one of its ingredients, and after the smaller of its two halves.
Three things the report does not do
It does not add on one price basis. The US$23.6 billion is ten years of dollars added together, and the report itself calls this series "nominal non-normalized" outflows: current dollars, in which a dollar of 2000 and a dollar of 2009 are added as though they were the same unit. The report knows how to correct for that. Its regional tables are published twice, once in current dollars and once in constant dollars at a 2005 base, deflated by the United States Producer Price Index. It did that for regions. It did not do it for countries, and the country figure is the one that travels.
It does not make a finding about Syria. Syria appears on thirteen of the report's hundred pages, and all thirteen are appendix tables. The study's narrative names no Syrian and draws no Syrian conclusion. A country claim was assembled from a row in a global dataset.
And it does not divide by anybody. The phrase "per capita" occurs nowhere in the report, and neither do "per head", "per person" or "population". I searched the whole document, not a section of it.
The release came before the report
The number went out to the press in a press release dated 1 December 2011 and headed "Syria Lost US$23.6 Billion in Illicit Financial Outflows from 2000-2009, Says Forthcoming GFI Report".
Forthcoming. The release describes a report "which will be released later this month". So the attribution to the study began before the study existed in public.
The conservative estimate is not in the release. Not qualified, not moved to a footnote: absent. I searched it, in the copy on Global Financial Integrity's own site that I captured on 12 August 2026, for 15.3, for 15,288, for conservative and high-end, and for normalis and normaliz to catch both spellings. None occurs. The range that Table 9 prints in two adjacent columns became, in the release, a single number.
The figure per head is in it. "In a country with a per capita GDP of just US$2,891 in 2010, these outflows represent a loss of US$1,048 for every Syrian citizen." That divides ten years of cumulative outflow by one year's population and sets the result beside one year's income per head: a decade of losses against a year of earnings, in one sentence, inviting a comparison neither number supports. The population it divides by is never stated. Dividing the release's US$23.6 billion by its US$1,048 implies about 22.5 million people, on my arithmetic.
Whose sentence that is matters. It is not the press office's arithmetic. It sits inside a block quotation of a blog post by Sarah Freitas, one of the study's two authors, published on the website of the Task Force on Financial Integrity and Economic Development. The post is dated 30 November 2011, the day before the release, and it carries the US$23.6 billion too. It does not mention the conservative estimate either: I searched the Internet Archive's copy of 12 January 2012 on the same terms, and for range as well. So the sequence is blog post, then press release, then the world, and the published range never entered the chain at any point between the study and the world.
The per-head construction was not invented for Syria. Three paragraphs after the Syrian sentence, the post reports the Los Angeles Times as saying that Gaddafi and his family hid more than US$200 billion in assets, "more than US$30,000 for every Libyan citizen". The construction was already in the newspaper. Its report of 21 October 2011, which I have read, opens with Gaddafi salting away more than US$200 billion, "about $30,000 for every Libyan citizen", according to senior Libyan officials. The form was borrowed from another country's coverage.
The release also supplies the theft reading. Its opening sentence says Syria "lost US$23.6 billion to corruption, crime and tax evasion". The sentence it quotes from the post is more careful, giving "corruption, trade mispricing, bribery, and other illicit activity", which at least names the modelling component. The release's own headline is more careful still, saying only "illicit financial outflows". Three wordings of one finding in one document, and the loosest of them is the opening sentence.
And the block quotation names a person. It asks that countries make it harder "for corrupt public officials like al-Asad to smuggle stolen assets out of their countries". The report names no Syrian and reaches no Syrian finding. Between an appendix table and a press release, a row in a global dataset acquired a country, a loss per head and a named individual.
Doing its job
None of that is dishonest, and I want to be clear about it. A press release exists to be quoted. It was doing its job. The derivation was done by exactly the right person, an author of the study, and it still ended up in the wrong document: a blog post on another organisation's website, reproduced in a release, and nowhere in the report. The point is that the release's job and the report's job are different, and only one of the two documents travelled.
What should travel is not long. Global Financial Integrity estimated Syria's cumulative illicit outflows over 2000 to 2009 at between US$15.3 billion and US$23.6 billion, in dollars of ten different years added together, and said of all its estimates that the truth may lie much closer to the higher end. On my arithmetic nearly three-quarters of the higher figure is trade mispricing; the rest is a balance-of-payments residual that, in the report's words, captures "the proceeds of bribery, theft, kickbacks, and tax evasion" without separating them. It is longer than a headline, and every number in it is either the report's own or my arithmetic on its tables.
Chapter 2 of the book follows three figures back to where they came from, and this is the second. The first is a number that dissolves when you follow it. The third is a number that matches when it should not, which is the harder failure to catch, because nothing about it looks wrong. Then the chapter asks why figures fail this way. Its answer is incentives, not conspiracy, and the first incentive it shows rather than asserts is this very release.
What the Record Shows, part 3 of 13. This article is drawn from my new book, Financing Syria's Reconstruction: The Numbers That Do Not Hold, which comes out in November 2026, in English in paperback and on Kindle and in Arabic on Kindle. Part 4 turns to solar power, and to a year that an international agency restated, after the year had closed, from 2 megawatts of off-grid capacity to 1,500. The book's public evidence register is already online. If you want to know when the book is out, the book page has a waiting list: one email, on the day it goes on sale.
The forthcoming book is Financing Syria's Reconstruction; passages drawn from it are from its current approved chapters and may change before publication.
Related posts
How a Cost of War Became a US$923 Billion Rebuild
An International Labour Organization factsheet says rebuilding Syria could cost "USD250 to USD 900+ billion". Follow its footnote and the upper figure turns out to be something else: the UN Development Programme's estimate of what the war cost, most of it output that was never produced. Here is the chain, link by link, and what the one number from a full assessment actually measures.
If Twenty-Five Billion Dollars Arrived Next Month
A hypothetical: the Syrian government receives US$25 billion next month. Could its banks hold the money, its offices turn it into projects, its laws carry the contracts and its people build them, and how long would it take? On the record I keep, the answer is not yet, not at that scale and not quickly, with exceptions the record names: multilateral grants, budget support and operators' own capital.
I Corrected My Own Book
My earlier book on Syria went on sale the week the World Bank published its estimate of what rebuilding the country would cost. My book said US$250 billion to US$400 billion. The Bank said US$216 billion. Here is what my range was missing, what else did not survive being checked, and why the corrections became a second book.